Message Boards Message Boards

0
|
4318 Views
|
4 Replies
|
3 Total Likes
View groups...
Share
Share this post:

Undesirable surfaces being generated while 3D Plotting using ListPlot3D

Posted 4 years ago

I solved a set of cubic polynomials and got a set of discrete points for plotting a 3D surface. Using ListPlot3D, I got the surface; but somehow, the plot has extra and undesirable surfaces towards the end of the 'time' variable domain. I checked out the code, and the points generated; but could not find any reason as to why these extra surfaces were getting generated. I tried limiting the time domain, but the surface still shows up with the same problems.

I then separately plotted 2D graphs versus the 'x' variable domain and another one versus the 't' variable domain. The variation of the dependent variable 'Gamma33' is almost a constant with time. This should obviously mean that the 3D surface should only be an extension of the first plot ( Gamma33 vs x) along the time domain. But what I get as the surface shows a difference, which I cannot understand.

Is it a problem with my code or the way I have complied the points generated? I've been stuck with this problem for a few days now; so it would be of great help if you guys could help me correct my errors. I've attached the notebook below.

P.S.: I'm just getting started on Mathematica, so please do forgive any of my mistakes you come across. It would be of great help if you'd come out to correct me.

Cheers..!

Attachment

Attachments:
POSTED BY: Joseph Joseph
4 Replies

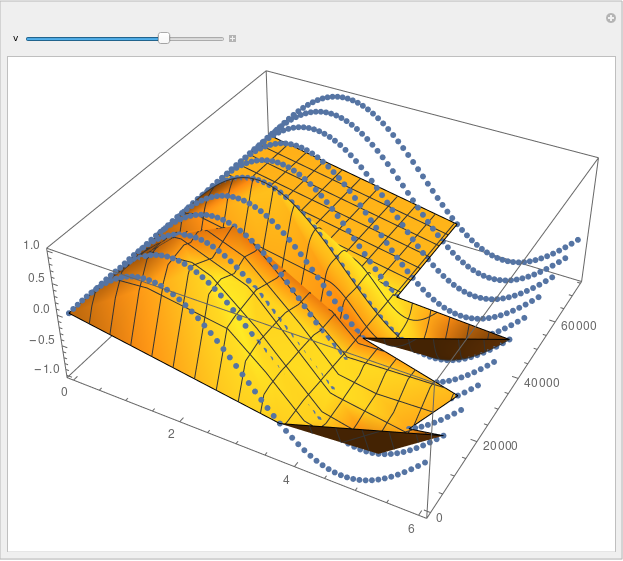
Well, yes: There seems to be something seriously wrong with ListPlot3D!

data0[\[FormalY]_] = Table[{x, \[FormalY], Sin[x]}, {x, 0, 6, .1}];
Manipulate[
 With[{data = Flatten[Table[data0[y], {y, 0, 10 10^v, 10^v}], 1]}, 
  Show[ListPlot3D[data, ImageSize -> Large], 
   ListPointPlot3D[data]]], {v, 1, 5}]

enter image description here

At least for:

$Version
(* Out:  "12.0.0 for Linux x86 (64-bit) (April 7, 2019)"  *)

Given that ListPlot3D is a rather "popular" function, this should be fixed soon ...

Addendum:

Case reported with the identification [CASE:4362592]

POSTED BY: Henrik Schachner

I have reported a similar problem a couple of months ago. Until today the issue still exists.

https://community.wolfram.com/groups/-/m/t/1786870

POSTED BY: Jürgen Kanz
Posted 4 years ago

Hi Henrik,

Thank you so much. Recalling the axes has kind of solved the problem for now; with only the time values being reduced to 1/10th their values. I had 5 sets of similar files with data points and graphs, and all of them had shown the same problem. They seem to look fine now; thanks to you..! I'm still pondering as to why this problem arose. Anyone in the forum could maybe give this a try and help us figure it out.

Regards,

Joseph

POSTED BY: Joseph Joseph

Hi Joseph,

You are right: In fact this seems to be a strange effect! Your data points data6 look like this:

ListPointPlot3D[data6]

enter image description here

There is actually no "undisirable surface"! But ListPlot3D in its simplest form is doing this:

ListPlot3D[data6, InterpolationOrder -> 0]

enter image description here

Even a simple rescaling of one axis helps:

ListPlot3D[{#1, #2/10, #3} & @@@ data6]

enter image description here

Maybe someone from the community can comment on this ...

Regards -- Henrik

Edit: To make things easier for anyone who wants to try I have the respective data attached.

data6 = << "data6.txt"
Attachments:
POSTED BY: Henrik Schachner
Reply to this discussion
Community posts can be styled and formatted using the Markdown syntax.
Reply Preview
Attachments
Remove
or Discard

Group Abstract Group Abstract