Group Abstract Group Abstract

Message Boards Message Boards

0
|
5.3K Views
|
4 Replies
|
3 Total Likes
View groups...
Share
Share this post:

Undesirable surfaces being generated while 3D Plotting using ListPlot3D

Posted 6 years ago
Attachment

Attachments:
POSTED BY: Joseph Joseph
4 Replies

Well, yes: There seems to be something seriously wrong with ListPlot3D!

data0[\[FormalY]_] = Table[{x, \[FormalY], Sin[x]}, {x, 0, 6, .1}];
Manipulate[
 With[{data = Flatten[Table[data0[y], {y, 0, 10 10^v, 10^v}], 1]}, 
  Show[ListPlot3D[data, ImageSize -> Large], 
   ListPointPlot3D[data]]], {v, 1, 5}]
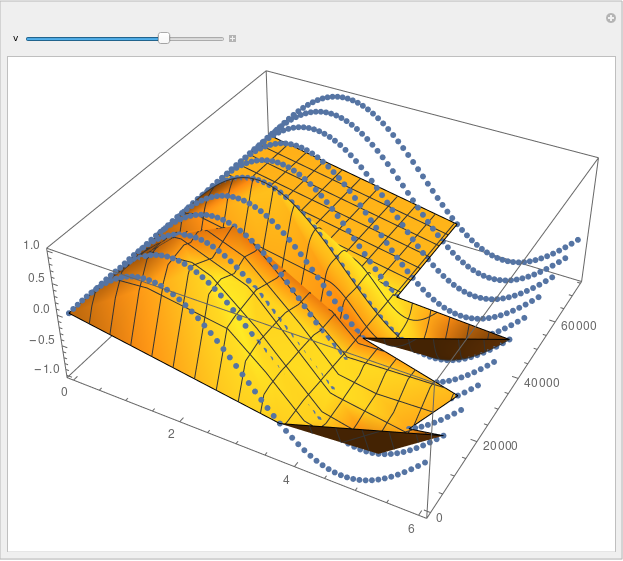
enter image description here

At least for:

$Version
(* Out:  "12.0.0 for Linux x86 (64-bit) (April 7, 2019)"  *)

Given that ListPlot3D is a rather "popular" function, this should be fixed soon ...

Addendum:

Case reported with the identification [CASE:4362592]

POSTED BY: Henrik Schachner

I have reported a similar problem a couple of months ago. Until today the issue still exists.

https://community.wolfram.com/groups/-/m/t/1786870

POSTED BY: Jürgen Kanz
Posted 6 years ago

Hi Henrik,

Thank you so much. Recalling the axes has kind of solved the problem for now; with only the time values being reduced to 1/10th their values. I had 5 sets of similar files with data points and graphs, and all of them had shown the same problem. They seem to look fine now; thanks to you..! I'm still pondering as to why this problem arose. Anyone in the forum could maybe give this a try and help us figure it out.

Regards,

Joseph

POSTED BY: Joseph Joseph
Attachments:
POSTED BY: Henrik Schachner
Reply to this discussion
Community posts can be styled and formatted using the Markdown syntax.
Reply Preview
Attachments
Remove
or Discard