Message Boards Message Boards

0
|
4214 Views
|
3 Replies
|
0 Total Likes
View groups...
Share
Share this post:

Set a ListContourPlot with ColorFunction

Posted 4 years ago

Hi,

I have an array of 2D data of form {{X, Y, A}, ...}, which I want to plot using ListContourPlot. The dependent variable A is integer and can have values from 1 to 8. ListContourPlot is working fine with the default colors. Though, I want to fix the color corresponding to each A value in the range 1 - 8. When I try it using ColorFunction/Which, all colors are messed up with incorrect o/p graphic. Attached file has the data with illustrations as how ListContourPlot behaves with/without ColorFunction.

In the file, the given data should show three different colors, but on using ColorFunction, two colors are replaced by BLACK, which is not even given for any value of A in RGB terms.

Will appreciate any suggestion. Thanks

Attachments:
POSTED BY: S G
3 Replies
Posted 4 years ago

Well, it looks like the argument passed to ColorFunction for ListContourPlot is not the z value, it is a subdivision of the range of z based on the number of contours.

cfArg = {};
ListContourPlot[A, ColorFunctionScaling -> False, ColorFunction -> ((AppendTo[cfArg, {##}]; Null) &)]
cfArg
(* {{1.}, {1.75}, {2.25}, {2.75}, {3.25}, {3.75}, {4.25}, {4.75}, {5.}} *)

Specify different values for the Contours option to see how it changes.

Not sure exactly what you are trying to visualize in the data, but one option would be to use ListDensityPlot. It's ColorFunction is passed the z value.

ListDensityPlot[A, ColorFunction -> (Which[
     # == 8, RGBColor[0.450385, 0.157961, 0.217975],
     # == 7, RGBColor[0.651843, 0.336334, 0.339878],
     # == 6, RGBColor[0.800087, 0.59154, 0.492369],
     # == 5, RGBColor[0.863299, 0.79059, 0.655388],
     # == 4, RGBColor[0.796267, 0.848236, 0.789746],
     # == 3, RGBColor[0.593149, 0.765374, 0.825786],
     # == 2, RGBColor[0.332685, 0.586361, 0.746847],
     # == 1, RGBColor[0.139681, 0.311666, 0.550652]] &),
 ColorFunctionScaling -> False]
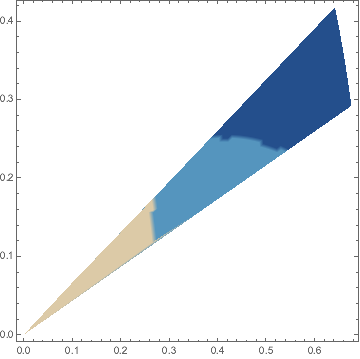
enter image description here

POSTED BY: Rohit Namjoshi
Posted 4 years ago
Attachments:
POSTED BY: S G
Posted 4 years ago

Hi SG

Does adding ColorFunctionScaling -> False to the second plot produce the desired result?

POSTED BY: Rohit Namjoshi
Reply to this discussion
Community posts can be styled and formatted using the Markdown syntax.
Reply Preview
Attachments
Remove
or Discard

Group Abstract Group Abstract