Well, it looks like the argument passed to ColorFunction for ListContourPlot is not the z value, it is a subdivision of the range of z based on the number of contours.
cfArg = {};
ListContourPlot[A, ColorFunctionScaling -> False, ColorFunction -> ((AppendTo[cfArg, {##}]; Null) &)]
cfArg
(* {{1.}, {1.75}, {2.25}, {2.75}, {3.25}, {3.75}, {4.25}, {4.75}, {5.}} *)
Specify different values for the Contours option to see how it changes.
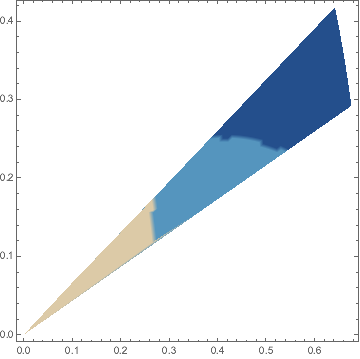
Not sure exactly what you are trying to visualize in the data, but one option would be to use ListDensityPlot. It's ColorFunction is passed the z value.
ListDensityPlot[A, ColorFunction -> (Which[
     # == 8, RGBColor[0.450385, 0.157961, 0.217975],
     # == 7, RGBColor[0.651843, 0.336334, 0.339878],
     # == 6, RGBColor[0.800087, 0.59154, 0.492369],
     # == 5, RGBColor[0.863299, 0.79059, 0.655388],
     # == 4, RGBColor[0.796267, 0.848236, 0.789746],
     # == 3, RGBColor[0.593149, 0.765374, 0.825786],
     # == 2, RGBColor[0.332685, 0.586361, 0.746847],
     # == 1, RGBColor[0.139681, 0.311666, 0.550652]] &),
 ColorFunctionScaling -> False]