Message Boards Message Boards

[NB] COVID-19 visualization of turning point

MODERATOR NOTE: coronavirus resources & updates: https://wolfr.am/coronavirus


"Turning point(TP)" in the fight against COVID19 has been arriving at China and other states in a stabilizing trend. In this article, we demonstrate a simple fitting by a logistic function (the Fermi distribution function) to visualize turning point(TP), as shown below:

enter image description here

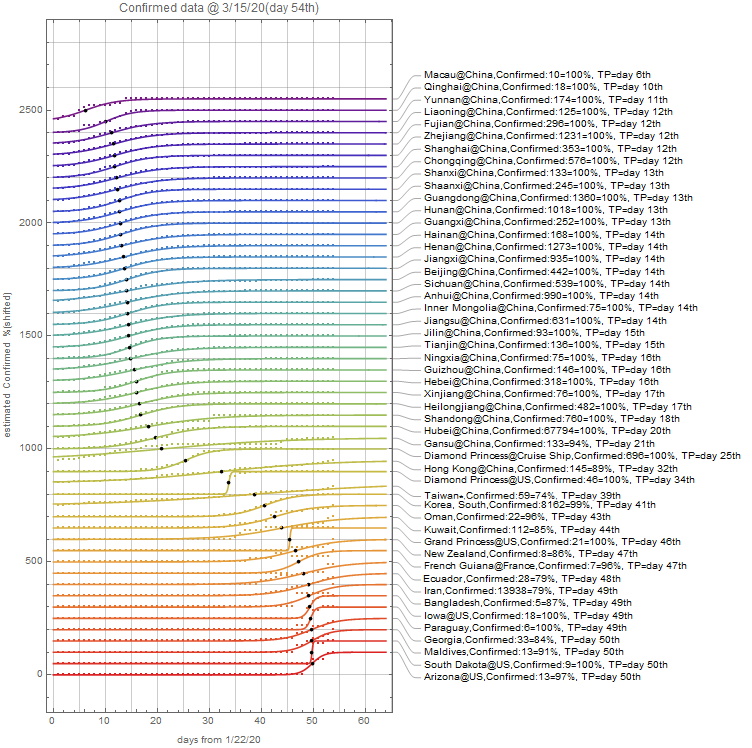
These data cannot be used for prediction but might be helpful to declare win against COVID19.

POSTED BY: Isao Maruyama
5 Replies

Thank you, a very interesting analysis!

May I store a copy of your notebook (with attribution) in my collection of covid-19 related analysis notebooks here: https://github.com/arnoudbuzing/wolfram-coronavirus/tree/master/notebooks ?

POSTED BY: Arnoud Buzing

Thank you for your comment !

Please store a copy of my notebook. I would be happy to contribute your github (and everyone's projects).

POSTED BY: Isao Maruyama

Thank you! I am planning to collect all these notebooks in a single place, so everyone can check them out and contribute!

POSTED BY: Arnoud Buzing

Thanks! I have actually stored it here (with many more notebooks from others and myself to follow):

https://github.com/WolframResearch/COVID-19/tree/master/Notebooks

POSTED BY: Arnoud Buzing

enter image description here -- you have earned Featured Contributor Badge enter image description here

Your exceptional post has been selected for our editorial column Staff Picks http://wolfr.am/StaffPicks and Your Profile is now distinguished by a Featured Contributor Badge and is displayed on the Featured Contributor Board. Thank you, keep it coming, and consider contributing to the The Notebook Archive!

POSTED BY: Moderation Team
Reply to this discussion
Community posts can be styled and formatted using the Markdown syntax.
Reply Preview
Attachments
Remove
or Discard

Group Abstract Group Abstract