Message Boards Message Boards

The SIR Model for Spread of Disease

Posted 4 years ago

MODERATOR NOTE: coronavirus resources & updates: https://wolfr.am/coronavirus


POSTED BY: Arnoud Buzing
32 Replies

Please don't mind my noob question as i am trying to learn mathematica. I tried to do your work in my pc but the blue,Red,green lines are not showing. Can someone tell me what i have done wrong or what should i do?

enter image description here

POSTED BY: Paritosh Kumar
Posted 1 year ago

In your screenshot the values for the equationS, equationI and equationR variables are simply not set

POSTED BY: Kirill Belov
Posted 1 year ago

Great post! Does anyone know how to draw the curves of the infected individuals (I) for different values of b (say from 0.1 to 0.6) on the same graph? Here I am referring to the state variable I and parameter b in the original post. Thank you so much!

POSTED BY: Mad Hew
Posted 2 years ago

Did you get an actual value of the total from your approach? I see only a plot, but no number, for say the period between day 0 and day 50.

POSTED BY: Ser Man
Posted 2 years ago

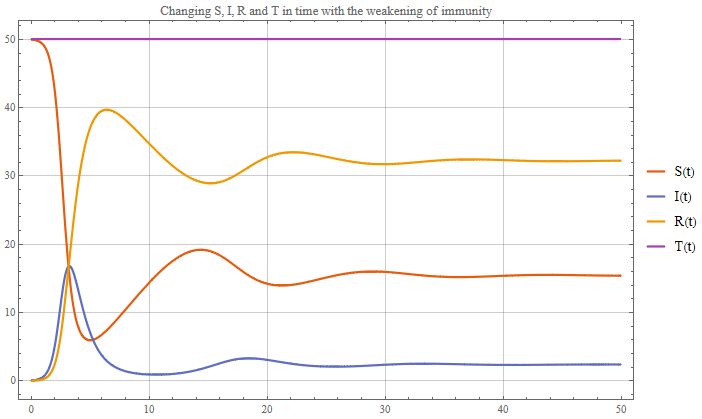
Hi Arnoud! I was asked for help by a student with a similar problem. There was a similar model, but it differed in that the loss of immunity over time was added. Those. those who fell ill once could get sick again. Actually below is the code and graphics.

Params1 = {T0 -> 50.05, a -> 0.07, b -> 1.08, c -> 0.08};

Conditions1 = {T[0] == T0, II[0] == T0*0.1/100, R[0] == 0};

SIRm = {
   S'[t] == -a*S[t]*II[t] + c*R[t], 
   II'[t] == a*S[t]*II[t] - b*II[t], 
   R'[t] == b*II[t] - c*R[t], 
   T[t] == S[t] + II[t] + R[t]
   };

{Smsol, IImsol, Rmsol, Tmsol} = 
  First[{S, II, R, T} /. 
    NDSolve[Join[SIRm, Conditions1] /. Params1, {S, II, R, T}, {t, 0, 
      50}]];

Plot[{Smsol[t], IImsol[t], Rmsol[t], Tmsol[t]}, {t, 0, 50}, 
 PlotTheme -> "Scientific", ImageSize -> Large, 
 PlotLegends -> {"S(t)", "I(t)", "R(t)", "T(t)"}, 
 GridLines -> Automatic, PlotStyle -> Thick, 
 PlotLabel -> 
  "Changing S, I, R and T in time with the weakening of immunity"]

enter image description here

POSTED BY: Kirill Belov
Posted 2 years ago

Hi Kiril, this model is very interesting. It seems also to be more in agreement with the natural fluctuations of epidemics. But I wonder, how does one then calculate the total of infected, when a new "batch" of individuals is infected "continuously". ?

POSTED BY: Ser Man
Posted 2 years ago

I think it's like a regular flu epidemic - a certain number of people get sick consistently throughout the year. If, for example, we add the dependence of immunity on the season, that is, reduce and increase the rate of its loss depending on the season, then we will also see seasonal fluctuations in the number of infected people. And about your question - I think you just need to calculate the definite integral, but with the exact time. Then we get the number of cases per year. Oh yes, the result will have to be divided by the average time of illness

POSTED BY: Kirill Belov
Posted 2 years ago

But I meant how to calculate the number of infected over a specified period of time, say t=0 to t=10 with your model.

POSTED BY: Ser Man
Posted 2 years ago

Like this?

enter image description here

POSTED BY: Kirill Belov
Posted 2 years ago

Hi Arnold, how do you calculate the total number of infected according to your model?

Thanks!

POSTED BY: Ser Man

I would suggest either RecurrenceTable or an explicit loop for obtaining a numerical solution in discrete time steps. The system might not be amenable to exact analytic results such as would be provided by RSolve.

POSTED BY: Daniel Lichtblau

I've just finished making a stochastic solver for compartmental models, and will be making a post to Community later this week.

POSTED BY: Robert Nachbar
Posted 4 years ago

Can this be replicated with discrete time?

POSTED BY: Y Getachew

I think so. But I have not tried it.

POSTED BY: Arnoud Buzing
Posted 4 years ago

II tried to replicate it in discrete time but RSolve/RSikvevakye couldn't solve it.

Attachments:
POSTED BY: Y Getachew
Posted 4 years ago
POSTED BY: David G
Posted 4 years ago

How do I calculate b from real data?

Here are the cases the begin of infecteds in São Paulo Brazilian State

data = {1,1,1,2,2,2,2,3,6,10,13,16,19,30,42,56,65,136,152,164,240,286,396,459,631,745,810};
Clear[a, k];
NonlinearModelFit[data, a Exp[k t], {a, k},  t]["BestFitParameters"]

{a -> 2.35641, k -> 0.219352}

It's somehow related to k?

POSTED BY: Updating Name

I am not sure how to best calculate b and k from actual data. This model is very simple and the real world is quite complex (different spreading rates for different people and places, and time-dependent spreading rates due to changing policies). It may be possible to get a fit for a current situation, but this fit probably has limited predictive value.

This model does have value to understand how changing the parameters affects the spreading of infectious diseases.

POSTED BY: Arnoud Buzing

enter image description here -- you have earned Featured Contributor Badge enter image description here

Your exceptional post has been selected for our editorial column Staff Picks http://wolfr.am/StaffPicks and Your Profile is now distinguished by a Featured Contributor Badge and is displayed on the Featured Contributor Board. Thank you!

POSTED BY: EDITORIAL BOARD
POSTED BY: Arnoud Buzing
POSTED BY: Robert Nachbar
Posted 2 years ago

Hi, I tried your method to estimate the total, with the command given below (" total= Integrate[solutionI[t_?NumericQ] , {t, 0, 100}] / i[0] ") but I don't get a number:

    b = 3.3925 // Rationalize; 
k = 5.9 // Rationalize;
 n = 157759;
 equationS = s'[t] == -b*s[t] i[t]/n; 
equationI = i'[t] == b*s[t] i[t]/n - k*i[t]; 
equationR = r'[t] == k i[t];

    solution =    NDSolve[{equationS, equationI, equationR, s[0] == 157756, 
        i[0] == 3, r[0] == 0}, {s, r, i}, {t, 0, 100}];

    solutionI[t_?NumericQ] := First[i /. solution][t];

  total=      Integrate[solutionI[t_?NumericQ] , {t, 0, 100}] / i[0] 
{max, arg} = NMaximize[{solutionI[t], 0 < t < 100}, t] 

p1 = Plot[i[t] /. solution, {t, 0, 100},   PlotRange -> All,   Epilog -> {Red, AbsolutePointSize[4],
        Point[{t /. arg, max}]}]

Is this model not suitable for your method?

Thanks

POSTED BY: Ser Man

I see the difficulty now.

I was interpreting the statement "Here we assume that the average recovery time is 14 days, which means that, on average, 1/14th of the infected population recovers” too broadly, that is, I was assuming you meant the total number of infected and not the current number of infected.

What you have is indeed correct. Sorry for the confusion.

POSTED BY: Robert Nachbar

The sentence would be clearer if it would say: "... 1/14th of the infected population recovers every day:"

POSTED BY: Luc Hens

No, this is an instantaneous rate, not a daily rate.

POSTED BY: Robert Nachbar

It has to have units of recoveries/time, and by design the time units are days.

POSTED BY: Daniel Lichtblau
POSTED BY: Robert Nachbar

Sure, but why are the values I am using incorrect? I am just using example values (which anyone can vary to experiment with this model?)

POSTED BY: Arnoud Buzing

Why, if the average recovery time is 14 days, does this imply that on average one third of the infected population recovers?

POSTED BY: Luc Hens

Sorry, that was a typo. I will see if I can fix the notebook text.

POSTED BY: Arnoud Buzing

I think I fixed it.

POSTED BY: Arnoud Buzing
Reply to this discussion
Community posts can be styled and formatted using the Markdown syntax.
Reply Preview
Attachments
Remove
or Discard

Group Abstract Group Abstract