Message Boards Message Boards

COVID-19 - R0 and Herd Immunity - are we getting closer?

Posted 4 years ago

MODERATOR NOTE: coronavirus resources & updates: https://wolfr.am/coronavirus


Are the measures taken getting us closer to herd immunity?

In this post I will look at one simple, but very important, aspect of a pandemic, namely herd immunity and what's required to reach it. My ambition is to write something that does not require any mathematical experience and that hopefully leaves you with a positive feeling at the end.

If you already know how exponential growth and herd immunity work, you may skip the first two sections.

Exponential growth - What is R0 and why is it important?

By now, most of you have heard about the R0 ,or basic reproduction number. To understand herd immunity you need to understand this number.

R0 tells you how many people, on average, each infected person will infect. If one person infects two on average, then the number is two. Below you can test a few different values and see how many persons will be infected within four steps (even though not entirely correct, you can think about it as days if you like) depending on R0 number. Select the R0 number and then drag the slider to see how many have been infected at any given point in time.

Initial stage with R0 2

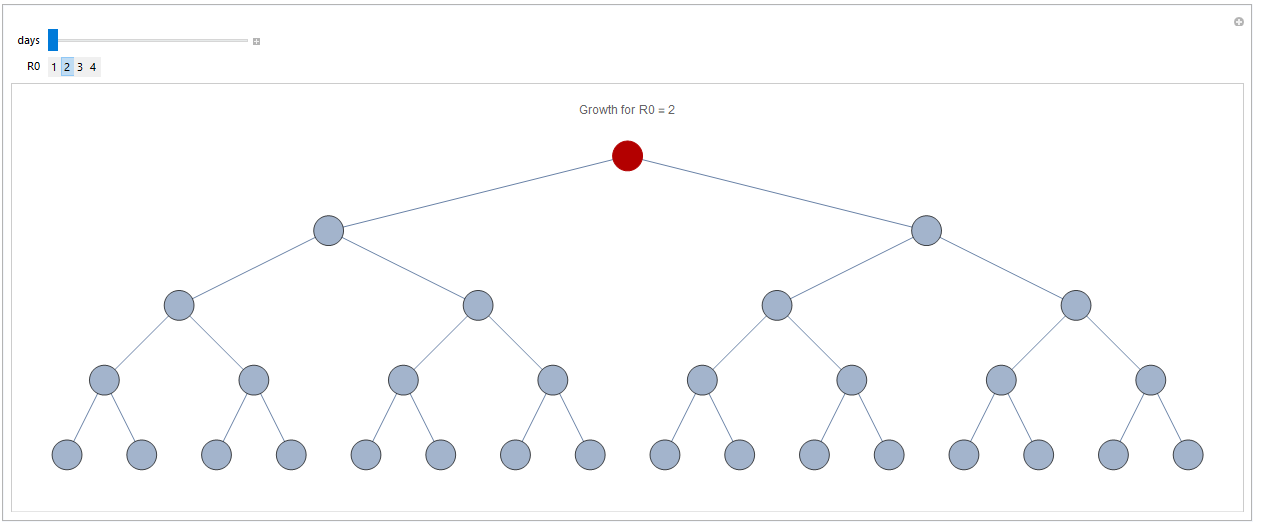
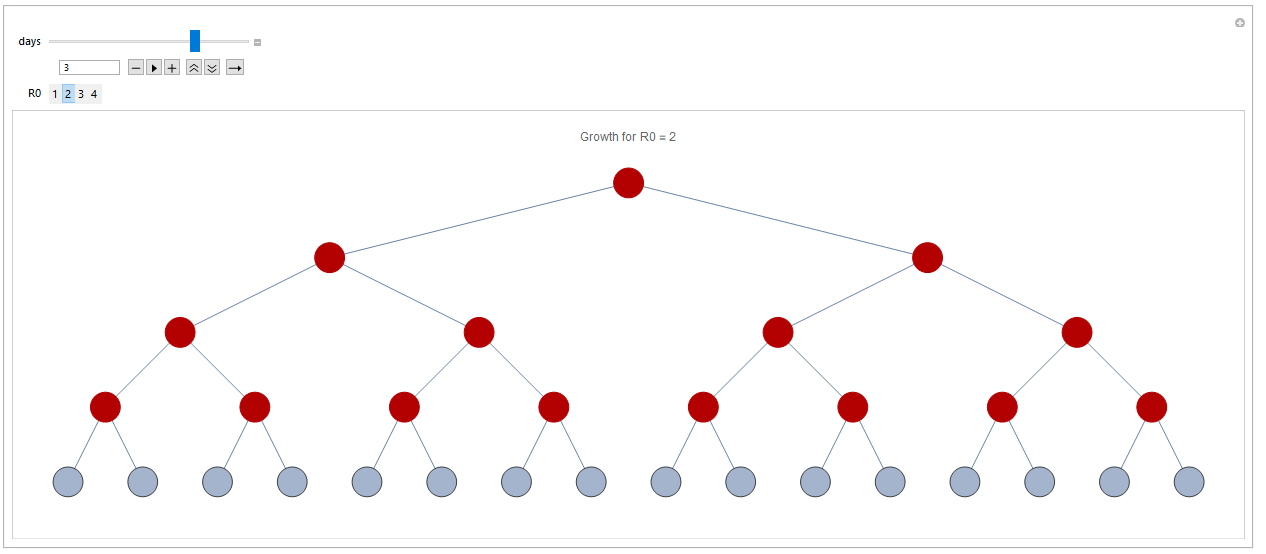
Infection after three days with R0=2:

Stage three of infection

For simplicity I have assumed that it takes one day before an infected person has infected everyone that they will infect. For COVID-19, just as for most it actually takes longer, so this slows down the process somewhat. However, the principle is the same.

COVID-19 is believed to have an R0 number between 1.4 and 3.9 (reference). As you can see the number of infected grows incredibly fast already at the higher range, but a bit more modest at lower.

If we assume no immunity, i.e. people can get sick again and again, then the growth for values between 1 and 4 would look like this:

growth depending on R0 - linear

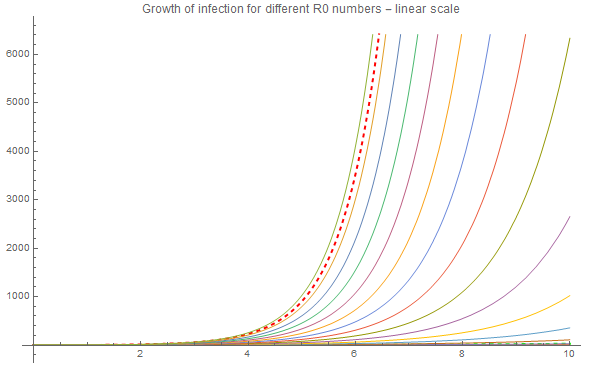
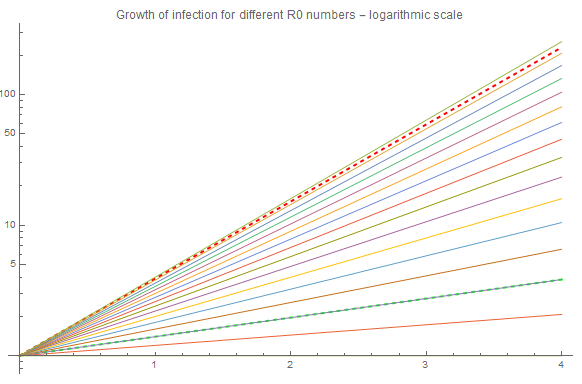
The red dashed curve represents R0 = 3.9, i.e. the upper range of COVID-19, and there is a green dashes representing the lower range, R0 = 1.4. This has a growth rate that is so close to zero, so it is hard to detect it. If we change to a a logarithmic plot it is easier to see:

growth depending on R0 - logarithmic

Immunity - How does immunity impact the epidemic?

Most people that get infected will recover and get immune. Let's look at the case of R0 = 2, with 50% of the population being immune. If you click the immune checkbox every second point will become green, indicating people that are immune. Now, the first infected will only infect one person, meaning that the first immune person is protecting every person on the left side. The first person at the right will be infected, but yet again he will only infect one person.

illustrating immunity

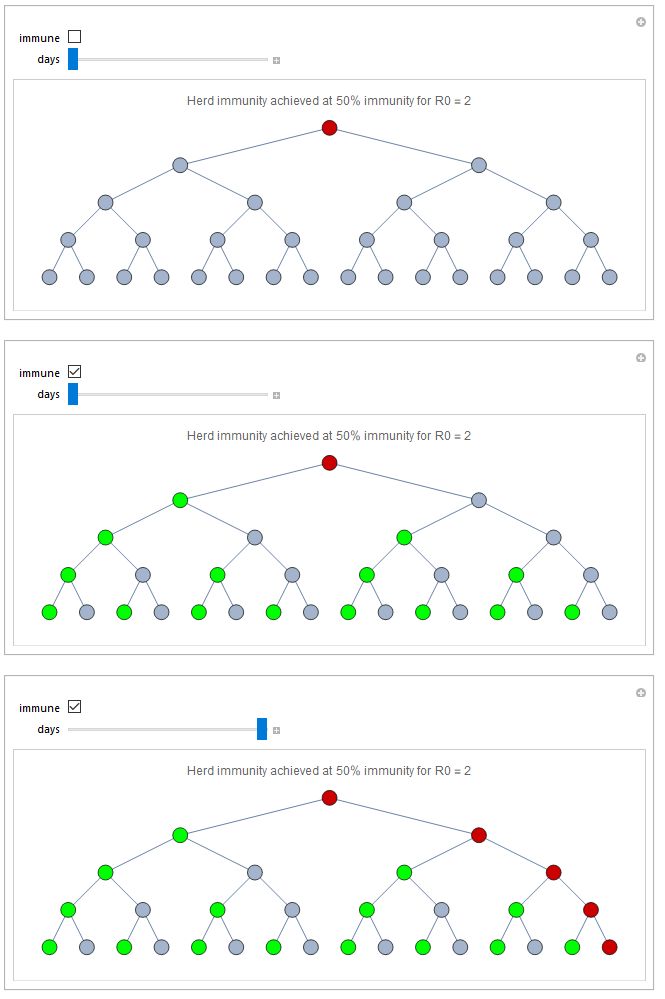
Immunity will not spread equally of course. For instance, instead of the scenario I showed above we could imagine that everyone at the left side is immune and non at the right hand side. The the whole right hand side would be infected after 5 days. On the other hand it is enough that person 2 and 3 are immune to stop the entire disease.

Of course the populations we are talking about are much larger than this example and people are connected in much more advanced network. However, the example above illustrates well the behavior one can expect in this situation. This can be summarized in a very simple equation:

s = 1 / R0

where s is the proportion of the population that is susceptible to the virus. Thus for R0 = 2 gives a threshold of 50%, R0 = 3 gives 33%, and R0 = 4 gives 25%, meaning that 50%, 67%, and 75%, respectively, has to be immune in order to achieve herd immunity. The average estimated R0 for COVID-19 is 2.65 which corresponds to around the 60% immunity that you probably heard epidemiologists talk about.

Current immunity and growth rates

Let us look at the current development in a few countries and how many have been identified as infected this far. I will remove the initial phase, and start from the day that each country reached 100 confirmed cases.

infected population - linear

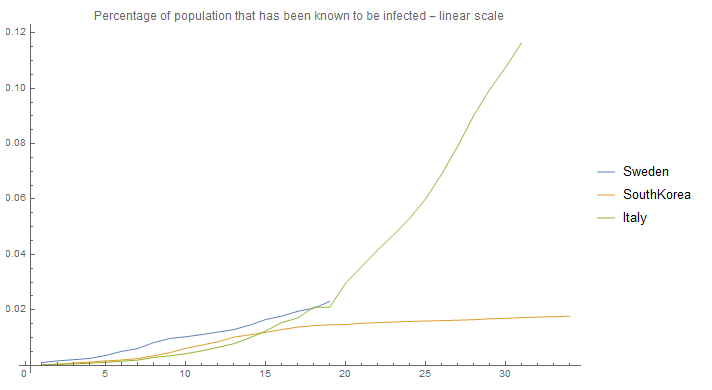
This looks quite different from the graph "Growth of infection for different R0 numbers - linear scale" showed previously, so let's look at the data in a logarithmic scale:

infected population - logarithmic

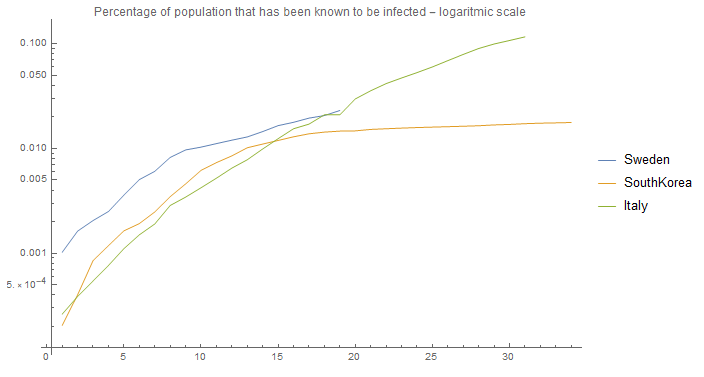
Instead of being straight lines as shown in "Growth of infection for different R0 numbers - logarithmic scale" the lines are flattening out over time. Why?

There are basically two possible solutions

  • either the population is getting immune
  • or the policies taken are having effects.

The graph, "Percentage of population that has been known to be infected - linear scale" showed that there has been so few cases yet, that there is probably no effect at all from herd immunity. At least assuming that the number of know cases are within one order of magnitude of the actual cases. Therefore the effect that immunity has on this policy dependent R0, let's call it RO^, can be neglected at this stage of the process (if we are lucky though there are a lot of unknown cases, that can help us get to herd immunity faster). Thus, the decrease of RO^ is likely due to policies.

If we take the ratio between each days we will get the current RO^:

daily growth rate

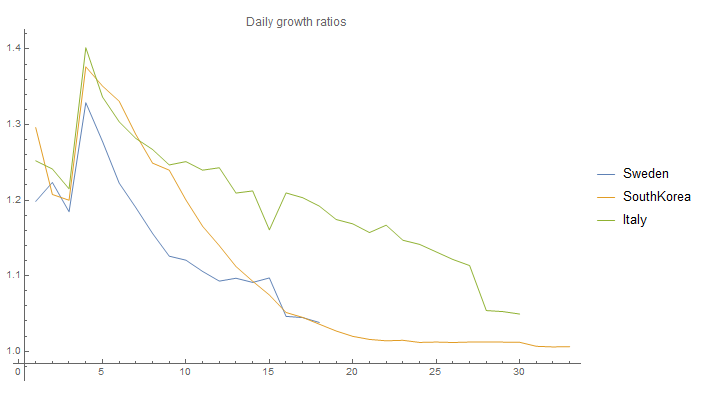
It is obvious that RO^ decreases over time for all three countries. This is actually the case for all countries, except for possibly the US. As seen it is very close to 1 in the case of South Korea, and even Italy is below 1.1!

Herd immunity - and why we are closer to reach it then you think

Remember that herd immunity is achieved when

s = 1 / R0

If we consider the case that each country maintains it's current policies, the herd immunity under those conditions is:

s = 1 / RO^

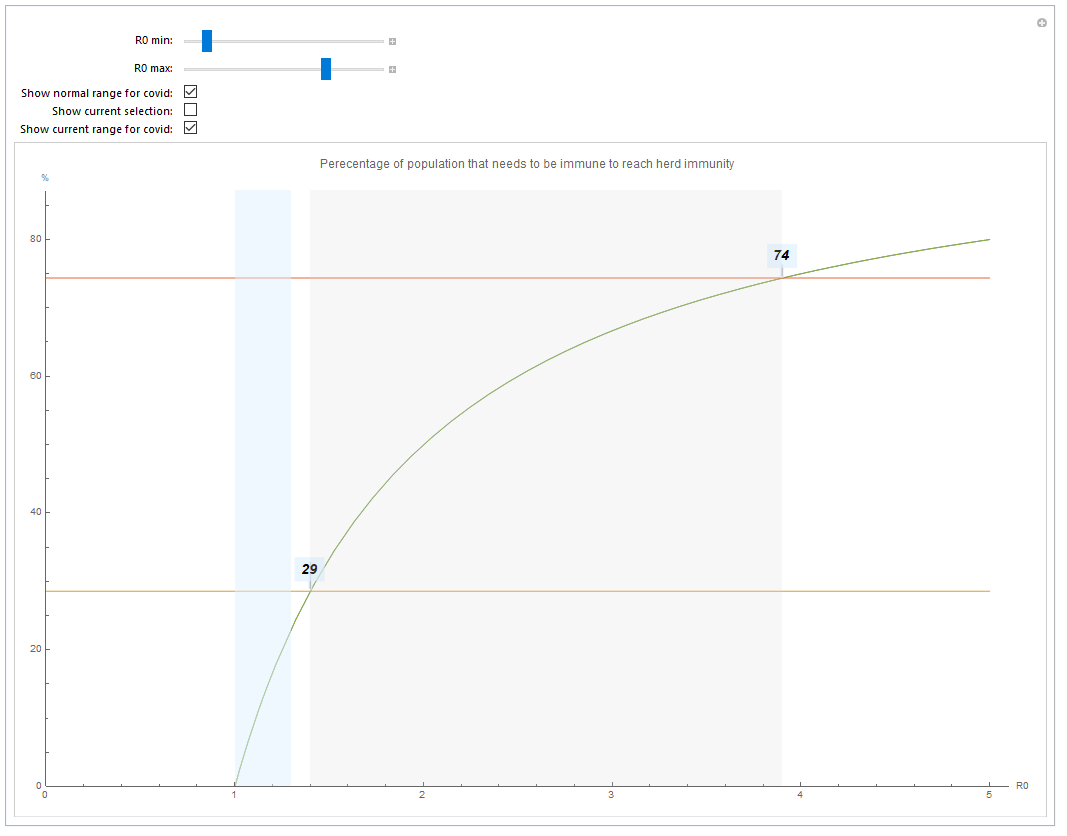
So let us look at which proportion of the population needs to be immune in order to get herd immunity.

  • Use R0 min and RO max to set an interval
  • The grey zone shows the R0 range (1.4 - 3.9) for COVID-19 according to current studies.
  • The orange will highlight your currently selected range (deactivated by default)
  • The blue range shows the current RO^ for countries with more than 100 cases (ranging from South Korea and possibly China to the US).
  • The horizontal lines show the immunity needed to reach herd immunity (i.e. between 29% - 75% for COVID-19)

R0 and immunity

Setting R0^ = 1.02 (South Korea's current value) results in only 2% needed for herd immunity, given that the current policies are kept. Sweden's 1.05 corresponds to 5%.

R0^ and immunity

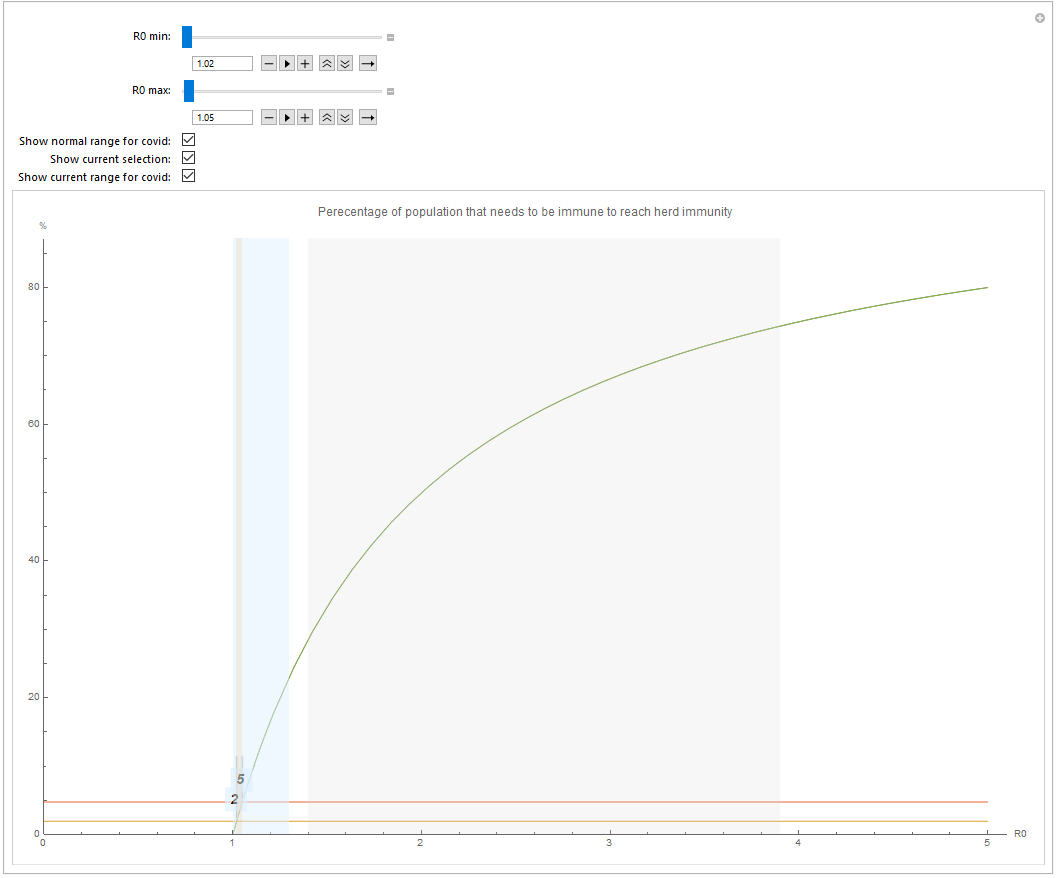
Of course these estimates are a bit rough, but they clearly give more hope that the measures taken in different countries are actually getting us towards herd immunity, if nothing else at least a policy dependent herd immunity. I plan to make a new post regarding how to use these policy dependent herd immunity to get towards a real herd immunity.

Attachments:
POSTED BY: Jan Brugard
10 Replies

Very nice post; most importantly, you show the effect of social distancing on disease impact. A few comments nonetheless: - You assume that "Most people that get infected will recover and get immune." Although it's likely the case based on analogy to similar viruses (the podcast This Week in Virology has had very good discussions about this), I think not only do we just don't know now, but there's also at least suspicion that people that did test negative on PCR could convert back to positive (unclear whether that's a true reconversion or if it's due to testing limitations) - see e.g. here). This may be nevertheless very relevant for modelling, as it could imply that SIR is not adequate. Practically speaking, this means that we don't have a good framework as to isolation of subjects that had tested positive but clinically recovered (if you think particularly about the case of healthcare workers, that could easily make them super-spreaders -using word non-technically). - Another thing is that infection removes people from the susceptible pool in two ways - by recovering and becoming immune or by dying. The test of herd immunity as a national policy for contagion management was abandoned by the UK and remains pursued by the Netherlands - I'm very worried, however, that it is likely to become a very costly strategy in terms of lives lost that could have been spared by using social distancing and/or contact tracing and isolation instead. - Finally for your positive thought "if we are lucky though there are a lot of unknown cases," I think there's starting to be accumulating evidence that that's likely the case (see e.g. here and there-they're reporting about half the cases were entirely asymptomatic).

Thanks again for a nice post making visible the effect of the public health measures!

F.

Well put, Jan.

When we come out of this if a few months (hopefully only a few), a large portion of the population will still be susceptible. I worry that new small outbreaks could spread rapidly, giving a so-called rebound. This behavior is not uncommon in dynamical system models such as the ones used for infectious diseases, and there is some evidence that real biological systems behave this way. Moreover, as Dr. Fauci (US NIH) said earlier this week, the pandemic will spread into the southern hemisphere, which is just entering its winter season, and from there it could easily reenter the northern hemisphere later this year or next where there will be lots of susceptible people, unless a vaccine can be discovered and delivered.

POSTED BY: Robert Nachbar

Current tests are PCR-based, detect current infection (or at least presence of virus RNA, ongoing debate about significance of positivity for infectivity after resolution of symptoms) with SARS-CoV-2 aka virus causing COVID-19, they would not be (true) positive unless someone is actively infected. Tests to detect prior infection with this virus are being developed but not yet available, they are the serologic assays you hear of. Not fully uptodate but good intro here.

Thanks.

I assume that you get immune after recovery as most data indicates that this far.

I assume that I can neglect the deaths as these are such a small proportion of the total population, but in a more detailed model this should be included (coming soon hopefully).

Whether different countries have a strategy of herd immunity or not is more of a communication issue than something that actually differs between countries I would say. The strategy that everyone has is to keep the growth so small that their Healthcare system can cope with it while at the same time going fast enough so society does not implode.

As heard immunity is so far away and the path is scary, most countries choose not to comunicate that as a strategy. Instead they focus on the current part of the strategy, namely to minimize the growth rate.

As it is a pandemic, every country would need to reach herd immunity to get things into balance. Some of that immunity could come through vaccines, but it will take quite some time before we have one.

POSTED BY: Jan Brugard

Could not agree more. This leads one to think that we may need to work on general better practices e.g. in medicine considering increasing use of telehealth under even "normal" circumstances (likely to help with minimising all nosocomial infections) and/or that we will have to have repeated periods of increasing social distancing until a vaccine is available.

Yes, and if that's right then it would be great. Because then the fatality must obviously be a lot lower than currently believed, and we would be much closer to immunity than we believe.

I highly doubt this though.

POSTED BY: Jan Brugard
Posted 4 years ago

Another possibility is that COVID has already been spreading for many months undetected and there is already some established herd immunity. There are claims that there were already spikes in flu-like deaths back in December, for example. Do the COVID tests detect whether one has ever been exposed, or just whether one is currently infectious?

POSTED BY: Bernard Gress

This post has been listed in the main resource-hub COVID-19 thread: https://wolfr.am/coronavirus in the section Computational Publications. Pleasee feel free to add your own comment on that discussion pointing to this post ( https://community.wolfram.com/groups/-/m/t/1911422 ) so many more interested readers will become aware of your excellent work. Thank you for your effort!

POSTED BY: Moderation Team
Posted 4 years ago

I agree with your statements here. Especially with regards to how the communication strategy (especially in the USA) is focused on the short-term mitigation plan, with no articulation of the higher level COVID-19 end-game strategy.

The Chinese model seems impossible for the USA, but the 60% infection for herd immunity is unacceptable. Is seems we are haphazardly stumbling toward a hybrid end game, with a combination of non-trivial number of survivors (~10%?) with immunity, a calibrated relaxing of social distancing (hopefully based on data), desperate short-term increase in hospital capacity, desperate attempts at improving treatment, and slow but massive gearing up test infrastructure.

It seems like what we really need is an R0 model that shows the effect of relaxing social distancing on virus survivors with immunity, relaxing restrictions on some subset of businesses, the effect of certain countermeasures like masks, etc.

Since factors tend to average out over large populations, it should be possible to make a model for R0 based on a few key factors. For example, % of people still coming to work, or % of people still taking public transportation, % of people with access to testing, etc. I suspect that a lot of things people think are important, like wearing masks and wiping down your Amazon deliveries, are basically irrelevant. I would be very interested in research to better model R0 and establish a data-based pareto of factors.

POSTED BY: Josh O

enter image description here -- you have earned Featured Contributor Badge enter image description here

Your exceptional post has been selected for our editorial column Staff Picks http://wolfr.am/StaffPicks and Your Profile is now distinguished by a Featured Contributor Badge and is displayed on the Featured Contributor Board. Thank you!

POSTED BY: Moderation Team
Reply to this discussion
Community posts can be styled and formatted using the Markdown syntax.
Reply Preview
Attachments
Remove
or Discard

Group Abstract Group Abstract