Thank you. Finally, I reproduced the result by changing the code as follows
COVID19CountyData =
ResourceFunction["NYTimesCOVID19Data"]["USCountiesTimeSeries"];
COVID19CountyData =
COVID19CountyData[All, "Cases",
TimeSeries[TimeSeriesInsert[#, {DateObject[{2020, 1, 20}], 0}],
ResamplingMethod -> {"Interpolation",
InterpolationOrder -> 0}] &];
COVID19CountyData =
COVID19CountyData[
KeySelect[! MissingQ[#] && !
MatchQ[#, Entity[_, {_, "Alaska" | "Hawaii", _}]] &]];
coord = CountryData["USA", "Polygon"][[1, 1, 1]];
bmr = BoundaryMeshRegion[coord, Line[Append[Range[Length[coord]], 1]]];
usatri = TriangulateMesh[bmr, MaxCellMeasure -> .1];
MeshRegion[
TransformedRegion[usatri,
ReflectionTransform[{1, 0}]@*RotationTransform[\[Pi]/2]],
MeshCellStyle -> {0 -> {PointSize[Small], Red}, 1 -> {Thin, Black}}]
usagcomp =
GraphicsComplex[GeoPosition[MeshCoordinates[usatri]],
MeshCells[usatri, 2, "Multicells" -> True]];
usstates =
EntityClass["AdministrativeDivision", "ContinentalUSStates"];
usasamp = GeoPosition /@ MeshCoordinates[usatri];
countypolys =
EntityValue[Normal[Keys[COVID19CountyData]], "Polygon",
"EntityAssociation"];
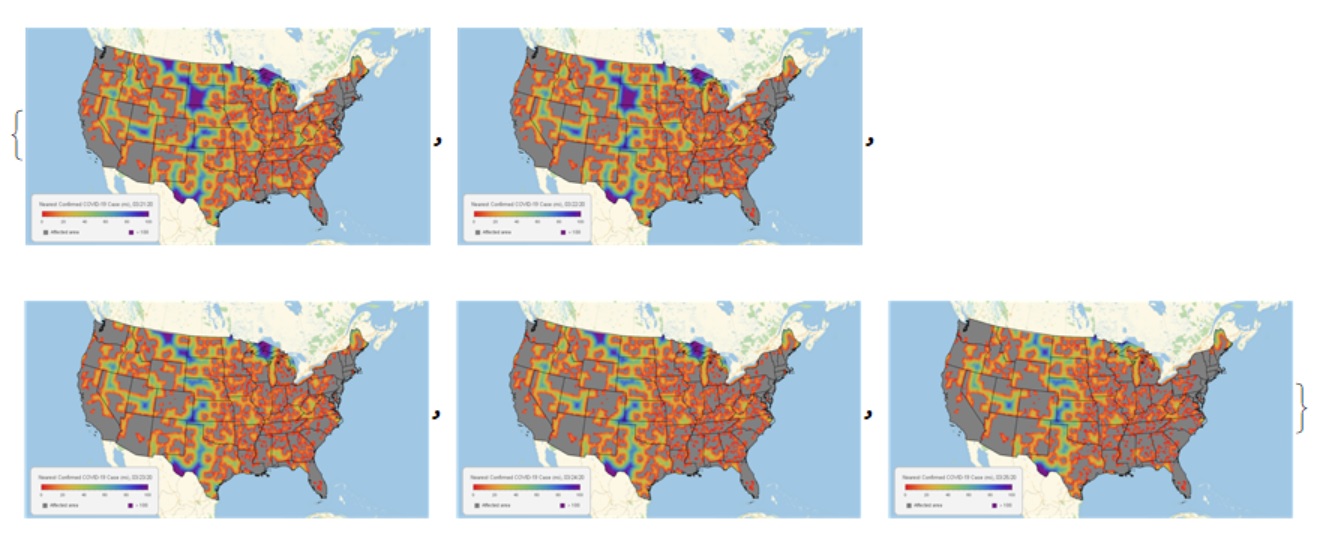
COVID19DistanceMap[date_DateObject?DateObjectQ] :=
Block[{counties, polys, coords, dists, gcomp, map, legend},
counties = COVID19CountyData[Select[#[date] > 0 &]];
polys = Lookup[countypolys, Normal[Keys[counties]]];
coords =
GeoPosition /@ Join @@ Cases[polys, _List?MatrixQ, \[Infinity]];
dists =
Clip[QuantityMagnitude[
Nearest[coords -> "Distance", usasamp][[All, 1]], "Miles"], {0.,
100.}];
gcomp =
Append[usagcomp,
VertexColors -> ColorData[{"Rainbow", {-100, 0}}] /@ Minus[dists]];
map = GeoGraphics[{GeoStyling[Opacity[1]],
gcomp, {Gray, polys}, {EdgeForm[Black], FaceForm[],
Polygon[usstates]}}, ImageSize -> 1024];
legend = makeLegend[date];
Legended[map, Placed[legend, {0.1725, 0.125}]]]
makeLegend[date_] :=
Framed[Column[{BarLegend[{ColorData[{"Rainbow",
"Reversed"}][.01 #] &, {0, 100}}, LegendLayout -> "Row",
ImageSize -> 300,
LegendLabel ->
Style["\[ThinSpace] Nearest Confirmed COVID\[Hyphen]19 Case \
(mi), " <> DateString[date, {"Month", "/", "Day", "/", "YearShort"}],
13, GrayLevel[0.2]]],
Row[{Spacer[24],
SwatchLegend[{Gray, ColorData["Rainbow", 0]}, {"Affected area",
"> 100"}, LegendMarkerSize -> 13,
LabelStyle -> GrayLevel[0.2], LegendLayout -> "Row",
Spacings -> {0.5, 10.5}]}]}, Spacings -> 0],
Background -> GrayLevel[0.95], RoundingRadius -> 10,
FrameStyle -> {AbsoluteThickness[1.5], GrayLevel[0.75]},
FrameMargins -> {{0, 10}, {10, 15}}]
But the last piece of visualization code is very slow. How can this be accelerated?
frames = ParallelMap[Rasterize[COVID19DistanceMap[#]] &,
  DateRange[DateObject[{2020, 3, 21}], DateObject[{2020, 3, 25}]],
  Method -> "FinestGrained"]