If you're using Graph, then supply the
VertexCoordinates -> {} to specify the coordinates of the vertices. Note that these must be supplied in the order of the vertex nodes, I think.
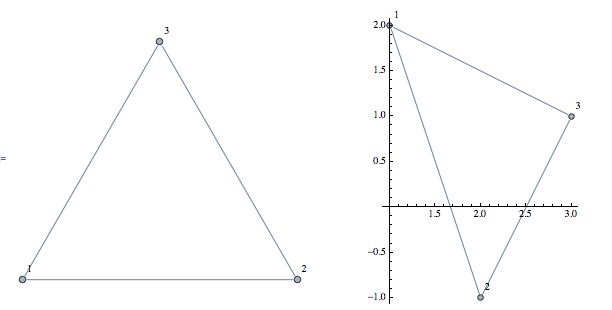
points = {{1, 2}, {2, -1}, {3, 1}}
Graph[{1 \[UndirectedEdge] 2, 2 \[UndirectedEdge] 3, 3 \[UndirectedEdge] 1},VertexLabels -> "Name"]
Graph[{1 \[UndirectedEdge] 2, 2 \[UndirectedEdge] 3, 3 \[UndirectedEdge] 1}, VertexLabels -> "Name", VertexCoordinates -> points, Axes -> True]
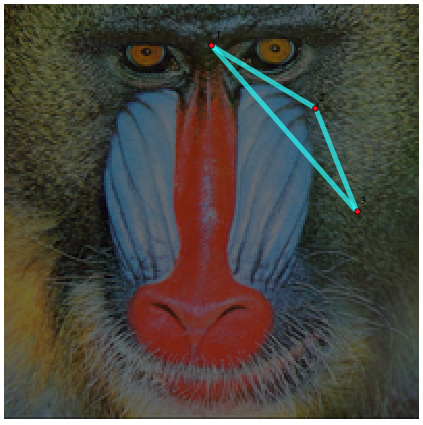
To place the graph over an image, you can use Overlay. Or you can have fun with the Prolog option in Graph:
points = {{100, 180}, {150, 150}, {170, 100}};
g = Graph[{1 \[UndirectedEdge] 2, 2 \[UndirectedEdge] 3,
3 \[UndirectedEdge] 1}, VertexLabels -> "Name",
VertexCoordinates -> points,
EdgeStyle -> Directive[{AbsoluteThickness[5], Cyan}],
VertexStyle -> Red, VertexSize -> Tiny,
Prolog -> {Raster[
ImageData[
Darker[ImageResize[
ExampleData[{"TestImage", "Mandrill"}], {200}], .5],
DataReversed -> True]]}, PlotRange -> {{0, 200}, {0, 200}}
]