Message Boards Message Boards

The limit to continuous space and the danger of graph plots

In collaboration with Johan-Tobias Schäg, we were able to create a rule producing an ordinary 2D-grid (https://community.wolfram.com/groups/-/m/t/1946413). Wolfram himself also mentions grids several times (see for example: https://www.wolframphysics.org/technical-introduction/limiting-behavior-and-emergent-geometry/recognizable-geometry/). It is often assumed in several of the texts I read on this subject (the last link is an example) that in the limit of making grids finer and finer we obtain the well known 2-dimensional continuous space. This is not correct, however. In fact, it seems quite complicated to come up with a graph structure that resembles classical 2D-space even remotely (the same is true for higher dimensions as well).

It is important to solve this problem since any model resembling physics should look like ordinary continuous space on large scales.

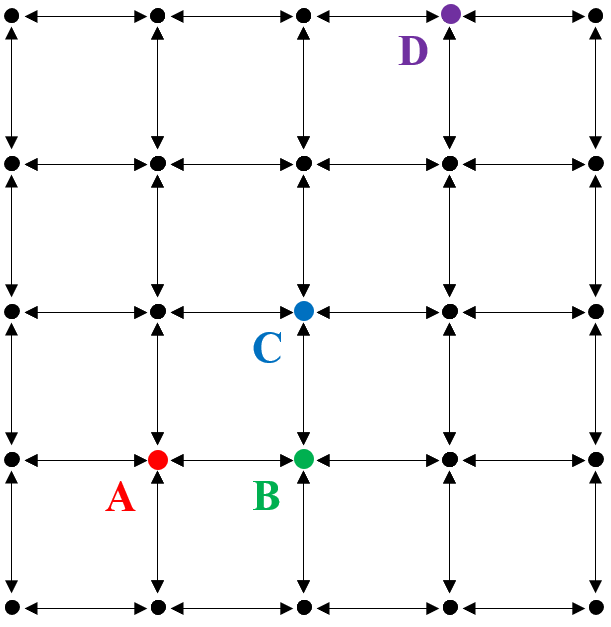
In order to illustrate this, I will consider the simplest case known to us all; the regular 2D-grid (see the figure below). I have drawn a piece of a 2D-grid, as well as four points on the grid labeled A, B, C, and D.

enter image description here

In the texts, I have read so far, there is no mention of how we think about distances in graphs. However, there are indirect hints. For example, when the subject of dimension and curvature is discussed, the distance $r$ from a point plays a crucial role. In these cases, the distance between two vertices is indirectly defined as the least number of (hyper)edges you would have to cross in order to get from one point to the other. This is a very logical definition, and I will keep using it here.

Now keep in mind, that the graphs we draw do not illustrate these distances correctly. They are only representations of the graph. For example, take another look at the picture of the grid above. The distance between A and B is 1 (you could call one edge for the fundamental length unit, or you could simply omit units for simplicity) and the distance between A and D is 5. The distance between B and C is also 1. However, as the graph is drawn on this picture, the distance between A and C should be $\sqrt{2}$, while the true answer is that the distance is 2! In fact, you could never create graphs with non-integer distances.

Okay, this is weird, but not problematic yet. After all, the graph should only look like ordinary space on large scales, and my example here is on the absolutely smallest scale possible. However, even on large scales, the answer is still the same. Imagine a huge grid with point A. Choose a direction and go $n$ steps in only that direction (left, right, up, and down are the possibilities on a grid). Now denote the point you end up at by B. There is no shorter path between the two points, which means that the distance between A and B is $n$. Now choose a new direction away from B, which is not the same (or opposite) as before. If you chose to go to the right away from A, you could choose to go upward now, for example. Go another $n$ steps up and label this point C. We are now in the same case as before, but by varying $n$ we can vary the scale of the setup as much as we want.

What is the distance between A and C? One path to take is to go from A to B and then from B to C as above. In fact, there is no shorter path than this either! So the distance is $2n$.

In the usual 2D-space, we expect the ratio between the distance from A til B (denoted $d(A,B)$) and from A til C to fulfill the following identity: $$\frac{d(A,C)}{d(A,B)}=\sqrt{2}$$ A non-integer value like this is no problem anymore (irrational numbers are, however, but never mind that for now). What is the case for our graph? Well, that is easily calculated: $$\frac{d(A,C)}{d(A,B)}=\frac{2n}{n}=2$$ The result is 2 no matter how huge $n$ is! You can make the grid as fine as you ever want it, but you will never get to the usual 2D-space. You could also say that the Pythagorean Theorem doesn't apply, which we know it has to in any physical space. The same problem arises for any regular grid.

There are two main points up until now: 1) do not believe in the distances drawn on a graph (even simple, regular ones), and 2) just because you get an infinitely fine grid, you do not automatically get continuous space.

All is not lost, however. Up until now, I have only mentioned regular grids. It is, however, not surprising if nature is not regular on the smallest of scales. In fact, I would be very surprised if that was really the case. Instead, a graph that appears 2-dimensional on large scales could very well look quite chaotic on the small scales. The vertices and edges could have very complicated and seemingly random connections (I have heard rumors of Wolfram mentioning this, but I am not sure). This could solve the problem, but the natural question then is this:

How do we create a grid which obeys the Pythagorean Theorem on large scales?

Other natural questions to ask are:

  • How do we deal with angles on large scales? How and when are they defined?

  • What happens to the irrational numbers that arise from the Pythagorean Theorem? Are they approximations?

  • Can we create a large scale isotropic graph?

POSTED BY: Malthe Andersen
17 Replies

I think I've made a graph capable of approximate on large scale the euclidean space. The method to make it is literally "cheating" because is produced iterating a simple algorithm on the euclidean 2D space to produce a suitable mapping of the space dependant by a single parameter (an angle that is obtainable dividing by an integer $2\pi$, so in some sense a single positive integer) Mapping In the image (I apologize for GeoGebra, but I used the first thing I had available on the computer), I've used an angle of $15°$.

Here you can find the project (I apologize again for having done the constructions manually, I'm thinking to write a real program that maybe compute some macroscopic distance and angle). If you change the partition angle (with $1°$ is visible) the partition cover finer and finer way the space. The use of a $\frac{2\pi}{n}$ angle is needed to obtain a FINITE graph from the computation. This with the fact that our universe is actually finite, is sufficient to say that at the end of the algorithm we have a finite number of nodes and edges. I'm going right now to make some suitable test at various scale.

An important needed step of the algorithm is to remove the double-counting of some points, and in the case, the node already exists, connect the node for which the algorithm is being applied with the existing node instead of introducing a new one.

To make sure the mapping preserves the circular symmetry from every point, the algorithm needs to be run for every node in the graph. The graph can be seen as completed when a successive application of the algorithm on any node, preserve the graph. I suppose this is possible from the finite space to map and from the $\frac{2\pi}{n}$ angle used for the partition.

PS: I apologize if I have not explained myself clearly, I prepare some programs and as soon as possible I publish them to make the concept clearer and finally have numbers in hand.

POSTED BY: Federico Pasqua

How do we create a grid which obeys the Pythagorean Theorem on large scales?

That's also called Euclidean distance

Can we create a large scale isotropic graph?

Both of these questions were resolved in this recent post of mine: https://community.wolfram.com/groups/-/m/t/1945186

Well i am not convinced yet. As there are many unclear things. Can you write a program (better a replacement rule based) which generates such a graph as you are thinking?

Could you also proof algebraically that a left and up movement results in a length of sqrt(2) in the limit?

Well i am not convinced yet. As there are many unclear things. Can you write a program (better a replacement rule based) which generates such a graph as you are thinking? Could you also proof algebraically that a left and up movement results in a length of sqrt(2) in the limit?

I won't have time, You could try to program the many interweaving grids (not just A and B, but A,B,C,D,...) and then measure the long range graph distance between two points that are on grid A.

I'm working on something similar, actually, I have some problem with the floating-point approximation in the really particular rule I'm using. Theoretically, the rule will converge for a portion of the euclidean space, but that isn't actually happening for approximation errors, so I'm rewriting all with a geometrical substitution rule (a little more complex to implement)

The method I'm using (the circle mapping of the euclidean space) is intended to preserve some fundamental rotational symmetry. For the distance, I'm using the number of jumps, even if in the paper the part about Minkowskian distance is REALLY incomplete and inaccurate about the mapping of the coordinates on the spatial, causal and brachial space.

POSTED BY: Federico Pasqua

What are you using floating point numbers for? You can just use my method instead. You can use it to build the graph by simple rules from which the Euclidean plane emerges: https://community.wolfram.com/groups/-/m/t/1945186

If you want to build a 4D Minkowski space you can use my new method instead, where the rotational invariance emerges from Wigner rotations: https://community.wolfram.com/groups/-/m/t/1953906

However, these (very beautiful) methods are not based on replacement rules. What I was experimenting with was a particular mapping of the Euclidean space through a specific substitution rule (which I am still studying) to preserve all (too much) of the Euclidean properties, even at an intermediate scale. For experimental working, I'm using a lot of rotation. Theoretically, with the right bounding condition the algorithm will need to converge, but the floating-point approximation breaks it all.

Furthermore, your methods are for the spacetime causal graph (if I understand decently, but I still have many doubts about the various mappings of the Wolfram model), while here we were trying to build a purely Euclidean space, therefore working on the space hypergraph.

I would also like to add that from the 4D Minkowsian method it is not evident, exactly as in the paper, how the mapping of the spacetime points on the whole lattice on which the Minkowskian distance is then defined, leaving room for an arbitrariness that leads to the complete breakage of any metric model based directly on a norm dependent on the coordinates and not on the topological characteristics of the graph.

In the end, you can't have a metric if you don't first specify how to interpret the topology, including the coordinates of the space.

But I may have understood cabbage for potatoes.

POSTED BY: Federico Pasqua

I would also like to add that from the 4D Minkowsian method it is not evident, exactly as in the paper, how the mapping of the spacetime points on the whole lattice on which the Minkowskian distance is then defined, leaving room for an arbitrariness that leads to the complete breakage of any metric model based directly on a norm dependent on the coordinates and not on the topological characteristics of the graph. In the end, you can't have a metric if you don't first specify how to interpret the topology, including the coordinates of the space.

I didn't read their paper but their findings on relativity seem to be complementary to mine. In my model each reference frame is a 16-cell honeycomb that provides you with coordinates.

16-cell honeycomb that provides you with coordinates

How?

If there is an arbitrariness to obtain the coordinates, and it is not possible to obtain it directly from the topology, it is a huge problem.

I believe that the use of lattice coordinates to define the Minkowskian norm is a huge conceptual error because it requires as a fact present here on page 13, that there is a valid graph embedding on a Euclidean space, and does not clearly demonstrate that it is guaranteed a priori.

The solution can come free from the removal of the concept of microscopic coordinate and be based entirely on the topology and the metric of the graph, defining the metric using the typical distance function of a graph, i.e. the minimum jump number to connect two points. In this way there is a very important criterion for mapping coordinates, that is that they must respect the metric just introduced. In this way, an effective, various and universal coordinate system is obtained, because there is the certainty that it preserves the most important characteristic of the graph, it's metric, to which everything is conceptually traced.

POSTED BY: Federico Pasqua

The solution can come free from the removal of the concept of microscopic coordinate and be based entirely on the topology and the metric of the graph, defining the metric using the typical distance function of a graph, i.e. the minimum jump number to connect two points. In this way there is a very important criterion for mapping coordinates, that is that they must respect the metric just introduced. In this way, an effective, various and universal coordinate system is obtained, because there is the certainty that it preserves the most important characteristic of the graph, it's metric, to which everything is conceptually traced.

Yes or you can use the Lorentz distance which is the length of the longest path along the directed edges, which is what I mentioned at the end of my post. It's the path with the most jumps, that's what it's all about. From this you can derive the Euclidean distance which is the length of some shortest path.

Anonymous User
Anonymous User
Posted 4 years ago

This paper might be of relevance: https://arxiv.org/pdf/gr-qc/0311055.pdf

POSTED BY: Anonymous User
Posted 4 years ago

If I understand clearly, this is about how to take a manifold and make it discrete such that Lorentz invariance is conserved.

This is not what I was thinking though. Two problems:

  • Time and space are fundamentally separated in the Wolfram model, and Lorentz invariance is guaranteed in "most" graphs automatically. The referenced text is interesting but maybe not that relevant.

  • If I understand it correctly, the idea to make a manifold discrete is to pick points on a manifold discontinuously (an intuitive approach indeed). The metric between these points is obtained by the metric from the manifold. This would, for example, be equivalent to me requiring the diagonal distances in the grid to be $\sqrt{2}$.

Especially the second problem was one of the main points of my post. Even when you can embed a graph, you simply cannot generally choose a metric like that. There is no way to know which manifold your graph would "fit into" (and they are certainly not unique).

The entire idea is to build a graph from "bottom up" so to say, rather than already having a manifold and build a graph onto it. Also it should be mentioned (not only for this comment, but some of the others too), that even if you have a set of points you don't have a graph. You still need to define the edges as well.

Having a graph with a manifold-induced metric is also kinda weird, since graphs should be thought of as abstract concepts which can (if desired) be drawn/embedded in an infinite different possible ways. Having a graph on a manifold "requires" you to embed it on that manifold in some sense.

POSTED BY: Updating Name

Questions for both your approaches (Leuenberger and Pasqua):

Can you specify more clearly what edges and vertices your eventual graphs consist of? When you intertwine two grids, Leuenberger, what edges do you create? Or, Pasqua, what are the edges and vertices of your graph? I assume the vertices are the crossings, while the edges are the lines "doing the crossing"? It seems to me to become extremely complicated to determine distances between points, so can you elaborate on that?

And mayby I am simply a bit slow, but how do you obtain Euclidean space in the limit? Remember that you cannot simply embed a graph in the plane and expect to "see" the correct distances.

I assume we all use the basic graph metric, otherwise, can you specify what other metric you use and justify why?

POSTED BY: Malthe Andersen
Anonymous User
Anonymous User
Posted 4 years ago

I think the point is if you draw a graph with each node having a random number of neighbors drawn from a Poisson process, this will eventually smooth out the metric so that you do not get the usual taxicab metric for a discrete cubic lattice.

POSTED BY: Anonymous User

When you intertwine two grids, Leuenberger, what edges do you create?

No edges are created, the grids are instead intertwined by unifying specified pairs of nodes into single nodes. But this method of construction is only for ease of explanation.

In reality a grid would be born within an older grid and they would be joined from the start and they would grow simultaneosely together in time direction.

Cool post, but I think that there may be some misunderstanding behind what you've written here. The metric induced on our hypergraphs is not the combinatorial metric (since clearly, as you say, this does not satisfy even the basic axioms of a Euclidean or Riemannian metric), but rather a discrete Riemannian metric, defined in terms of the 1-Wasserstein distance on volume measures in the hypergraph. The complete mathematical details of this are covered in my relativity paper here http://wolframphysics.org/technical-documents/, as cited multiple times within Stephen's introduction. I also wrote a Q&A answer about specifically this question, because I suspected it would result in a common misunderstanding: https://www.wolframphysics.org/questions/spacetime-relativity/why-do-you-get-a-euclideanriemannian-metric-as-opposed-to-a-taxicab-metric-induced-on-your-hypergraphs/

Did I miss something here? What exactly are you trying to do?

POSTED BY: Jonathan Gorard
Posted 3 years ago

Scale relativity and fractal space-time may give you the answer you are looking for. Basically distances and the smoothness of space depends upon what scale you are looking at, specifically in a fractal-like space.

https://arxiv.org/abs/0812.3857

POSTED BY: Jeff Yates
Reply to this discussion
Community posts can be styled and formatted using the Markdown syntax.
Reply Preview
Attachments
Remove
or Discard

Group Abstract Group Abstract