Message Boards Message Boards

0
|
5546 Views
|
2 Replies
|
2 Total Likes
View groups...
Share
Share this post:

Graphs of complex functions with Mathematica 9

Posted 11 years ago
Hi everyone, I was trying to graph some functions of a complex variable on mathematica 9, but without success.. so I googled a little bit and found this helpful guide including various graphs of the Gamma funcion. http://mathworld.wolfram.com/notebooks/SpecialFunctions/GammaFunction.nb
So I tried to enter the commands suggested by the guide in Mathematica 9 (hoping to obtain some graphs) and nothing... seems mathematica 9 doesn't recognise at all commands like  "ComplexPlot3D" or "ComplexContourPlot".
In particular i need to graph this complex function: y=e^z and f(z)=((z^2-1)(z-2-i)^2)/(z^2+2+2i)

Thankyou very much !
POSTED BY: Edoardo Ottoni
2 Replies
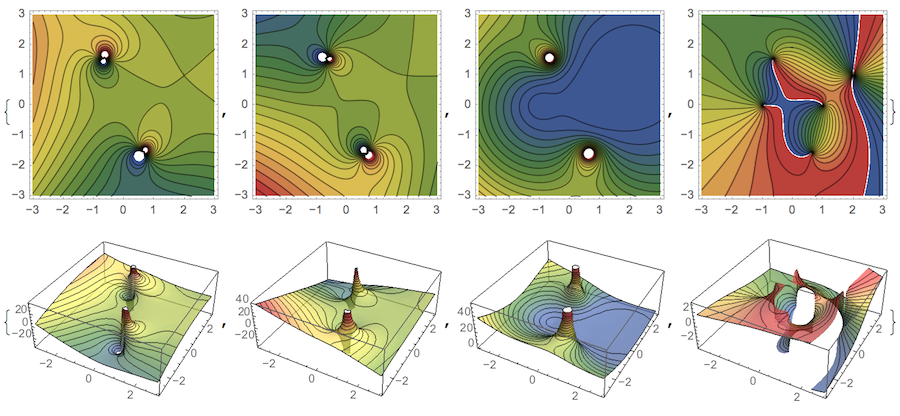
 f[z_] := ((z^2 - 1) (z - 2 - I)^2)/(z^2 + 2 + 2 I);
 
 
 ContourPlot[Evaluate[#[f[x + I y]]], {x, -3, 3}, {y, -3, 3},
    ColorFunction -> "DarkRainbow", Contours -> 20] & /@ {Re, Im, Abs,
   Arg}
 
 
 Plot3D[Evaluate[#[f[x + I y]]], {x, -3, 3}, {y, -3, 3},
   ColorFunction -> "DarkRainbow", MeshStyle -> Opacity[.5],
   MeshFunctions -> (#3 &), Mesh -> 20,
   PlotStyle -> Opacity[.7]] & /@ {Re, Im, Abs, Arg}

POSTED BY: Vitaliy Kaurov
Posted 11 years ago
Umbeliaveble ! Exactly what I was looking for ! Thankyou so much
POSTED BY: Edoardo Ottoni
Reply to this discussion
Community posts can be styled and formatted using the Markdown syntax.
Reply Preview
Attachments
Remove
or Discard

Group Abstract Group Abstract