Message Boards Message Boards

0
|
3936 Views
|
3 Replies
|
0 Total Likes
View groups...
Share
Share this post:

While or For to create many points on 1 graph with fewer lines of code?

Posted 11 years ago
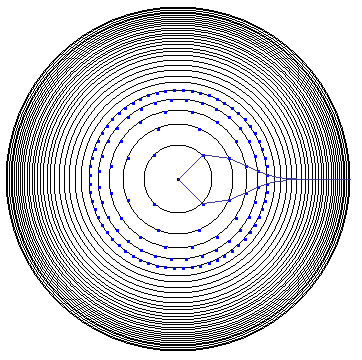
I'm using Mathematica to create this graphic and would like to be able to add points around a few more of the concentric circles without writing 2^n lines of code for each one. As you can see below, I created this by setting each Graphics and Graphics to a variable (like a4 or g3) then by calling Show on each. Is there a way to use While or For to do this, or some other solution where the points can be created with fewer lines of code. Thank you!


How do I make the next circle have points at (Log[2,7] Cos Pi/128, Log[2,7] Sin Pi/128),
then (Log[2,7] Cos 3 Pi/128, Log[2,7] Sin 3 Pi/128), etc.,
all the way to (Log[2,7] Cos 255 Pi/128, Log[2,7] Sin 255 Pi/128)?

I've included portions of my code below.
 g0 = Graphics[Circle[{0, 0}, Log[2, 2]]]
 g1 = Graphics[Circle[{0, 0}, Log[2, 3]]]
 g2 = Graphics[Circle[{0, 0}, Log[2, 4]]]
 ...
 a8 = Graphics[  Point[{Log[2, 3] Cos[Pi/8], Log[2, 3] Sin[Pi/8]},    VertexColors -> {Blue}]]
 a9 = Graphics[  Point[{Log[2, 3] Cos[3 Pi/8], Log[2, 3] Sin[3 Pi/8]},    VertexColors -> {Blue}]]
 a10 = Graphics[  Point[{Log[2, 3] Cos[5 Pi/8], Log[2, 3] Sin[5 Pi/8]},    VertexColors -> {Blue}]]
 a11 = Graphics[  Point[{Log[2, 3] Cos[7 Pi/8], Log[2, 3] Sin[7 Pi/8]},    VertexColors -> {Blue}]]
 ...
a127 = Graphics[  Point[{Log[2, 6] Cos[127 Pi/64],     Log[2, 6] Sin[(127 Pi/64]}, VertexColors -> {Blue}]]
Show[g0, g1, g2, g3, g4, g5, g6, g7, g8, g9, g10, g11, g12, g13, g14, \g15, g16, g17, g18, g19, g20, g21, g22, g23, g24, g25, g26, g27, g28, \g29,...]
POSTED BY: JM Ruby
3 Replies
Many programming languages take a completely different philsophy with their graphics system than Mathematica:  usually they have a set of functions which do something, namely draw on a canvas, which doesn't get erased until you explicitly erase it yourself.

The code you wrote follows this type of thinking, and doesn't match Mathematica's graphics functionality very well.

In Mathematica, instead of having a set of functions which draws simple shapes, you have a set of heads/symbols which represent simple shapes.  In other words Mathematica takes  a delarative approach to graphics, not a procedural one.  Both approaches have their advantages and disadvantages.

In Mathematica the better approach is to build up the graphics object first (Sean Clarke's Table command) and display it in one go later.  If you need to modify it, e.g. add more points, then instead of modifying the existing graphics object, you'd typically go back to the set of commands that generated it and modify those.

Going back to your example, the code I'd write would probably look similar to this: 1. generate a list of circles.   2. generate a list of coordinats.  3. wrap the coordinates by Point[].  4. wrap everything by Graphics[].  To add more points, I'd modify step 2 and re-run steps 2-4.  Working with a notebook interface is really helpful here.  Re-running these steps with a traditional command line interface would be rather painful.
POSTED BY: Szabolcs Horvát
Posted 11 years ago
Thank you. I completed my project quickly with this. I'm learning more about Table for future tasks.
POSTED BY: JM Ruby
Use the Table command to build a list of values.
Graphics[Table[Circle[{0, 0}, Log[2, i]], {i, 1, 10}]]
Similarly we can make more complicated tables and use Graphics on them:

Graphics[
Table[Point[{Log[2, i] Cos[theta], Log[2, i] Sin[theta]}], {i, 1, 10}, {theta, Pi/8, 2 Pi, 2 Pi/8}]
]

See the documentation on Table for more basic examples before trying Table about with Graphics expressions such as these.  In general, While and For loops make code more complicated than it needs to be. 
POSTED BY: Sean Clarke
Reply to this discussion
Community posts can be styled and formatted using the Markdown syntax.
Reply Preview
Attachments
Remove
or Discard

Group Abstract Group Abstract