Message Boards Message Boards

0
|
3612 Views
|
2 Replies
|
1 Total Likes
View groups...
Share
Share this post:

[Solved] I have Plot issue in Mathematica code. Kindly sort it out.

Posted 4 years ago

Ergo sphere Plot

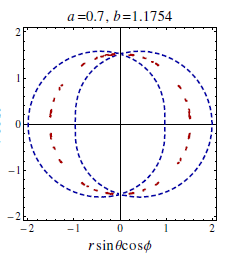
This graph is plotted from equation:

    M=1;a;0.7;b=1.1754;
    r^2 + a^2 Cos[\[Theta]]^2 - 2 M (1 - (2.718)^(-r^3/b^3)) r .
    M = 1; a = 0.4; b = 1; NSolve [{r^2 + a^2 Cos[\[Theta]]^2 - 
        2 M (1 - (2.718)^(-r^3/b^3)) r == 0, 0 <= r <= 8}, r]

    ParametricPlot[{rSin[\[Theta]], rCos[\[Theta]]} {\[Theta], -\[Pi], \[Pi]}]

It is solved numerically for r but no \theta is value initially put in the equation otherwise it gives a circle and I need the plot as above mentioned (Parametrically plotted or Polar Plotted).

POSTED BY: nani khan
2 Replies

First, I suppose that your piece of code is kind of messy, so I picked just a part of it and recasted into "supposed-to-work" Wolfram code:

M = 1;
a = 0.4;
b = 1;

r = NSolve[{r^2 + a^2 Cos[\[Theta]]^2 - 2 M (1 - (2.718)^(-r^3/b^3)) r == 0, 0 <= r <= 8}, r];
ParametricPlot[{r * Sin[\[Theta]], r * Cos[\[Theta]]}, {\[Theta], -\[Pi], \[Pi]}]

If got your idea correctly then here's my explanation and the solution.

The problem is that NSolve (as far as I know) does not allow use of unset parameters like "Theta" in the equation it solves, so the right-hand-side of the penultimate line in the code above remains unevaluated. Then, NSolve returns a list of replacement rules, not numbers. Finally, the solution might be not unique; for example, for the mentioned values of paramters M, a and b and Theta = Pi there are two solutions for r whithin [0, 8] interval.

So, I came up with the following code:

sol[\[Theta]_] := NSolve[{r^2 + a^2 Cos[\[Theta]]^2 - 2 M (1 - (2.718)^(-r^3/b^3)) r == 0, 
0 <= r <= 8}, r]

ParametricPlot[
 Transpose[{(r /. sol[\[Theta]] )* 
    Sin[\[Theta]], (r /. sol[\[Theta]] )* 
    Cos[\[Theta]]}] , {\[Theta], -\[Pi], \[Pi]}]

This code works like this: the equation for r is solved numerically for each value of Theta inside the ParametricPlot function and the solutions are substituted in place of r. Transposition is required to form different curves for each branch of solutions. This is probably not the most efficient solution, but it works. I got this plot:

enter image description here

P.S. The strange thing is that your equation does not have solutions in the specified domain for Theta = Pi and the first set of parameters:

M=1; a = 0.7; b=1.1754;

POSTED BY: Nikolay Shilov
Posted 4 years ago

Thank you for the reply. I am satisfied with your solution.

POSTED BY: nani khan
Reply to this discussion
Community posts can be styled and formatted using the Markdown syntax.
Reply Preview
Attachments
Remove
or Discard

Group Abstract Group Abstract