First, I suppose that your piece of code is kind of messy, so I picked just a part of it and recasted into "supposed-to-work" Wolfram code:
M = 1;
a = 0.4;
b = 1;

r = NSolve[{r^2 + a^2 Cos[\[Theta]]^2 - 2 M (1 - (2.718)^(-r^3/b^3)) r == 0, 0 <= r <= 8}, r];
ParametricPlot[{r * Sin[\[Theta]], r * Cos[\[Theta]]}, {\[Theta], -\[Pi], \[Pi]}]
If got your idea correctly then here's my explanation and the solution.
The problem is that NSolve (as far as I know) does not allow use of unset parameters like "Theta" in the equation it solves, so the right-hand-side of the penultimate line in the code above remains unevaluated. Then, NSolve returns a list of replacement rules, not numbers. Finally, the solution might be not unique; for example, for the mentioned values of paramters M, a and b and Theta = Pi there are two solutions for r whithin [0, 8] interval.
So, I came up with the following code:
sol[\[Theta]_] := NSolve[{r^2 + a^2 Cos[\[Theta]]^2 - 2 M (1 - (2.718)^(-r^3/b^3)) r == 0,
0 <= r <= 8}, r]

ParametricPlot[
 Transpose[{(r /. sol[\[Theta]] )*
    Sin[\[Theta]], (r /. sol[\[Theta]] )*
    Cos[\[Theta]]}] , {\[Theta], -\[Pi], \[Pi]}]
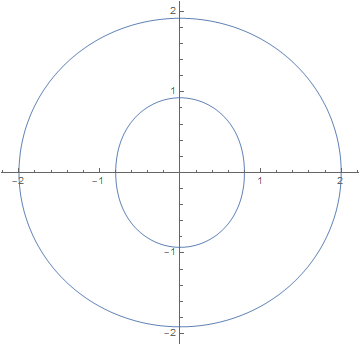
This code works like this: the equation for r is solved numerically for each value of Theta inside the ParametricPlot function and the solutions are substituted in place of r. Transposition is required to form different curves for each branch of solutions. This is probably not the most efficient solution, but it works. I got this plot:
P.S. The strange thing is that your equation does not have solutions in the specified domain for Theta = Pi and the first set of parameters:
M=1; a = 0.7; b=1.1754;


