Hi,
I think you will have probably figured out by now, but maybe this could be helpful to others.
As explained here https://wolframphysics.org/technical-introduction/the-updating-process-for-string-substitution-systems/events-and-their-causal-relationships/, there is an orange arrow between event A and B if and only if all or part of the input of event B was in the output of event A.
It is quite difficult to see that in the graph you posted, because the pictures of the events are small and it isn't easy to understand what is going on.
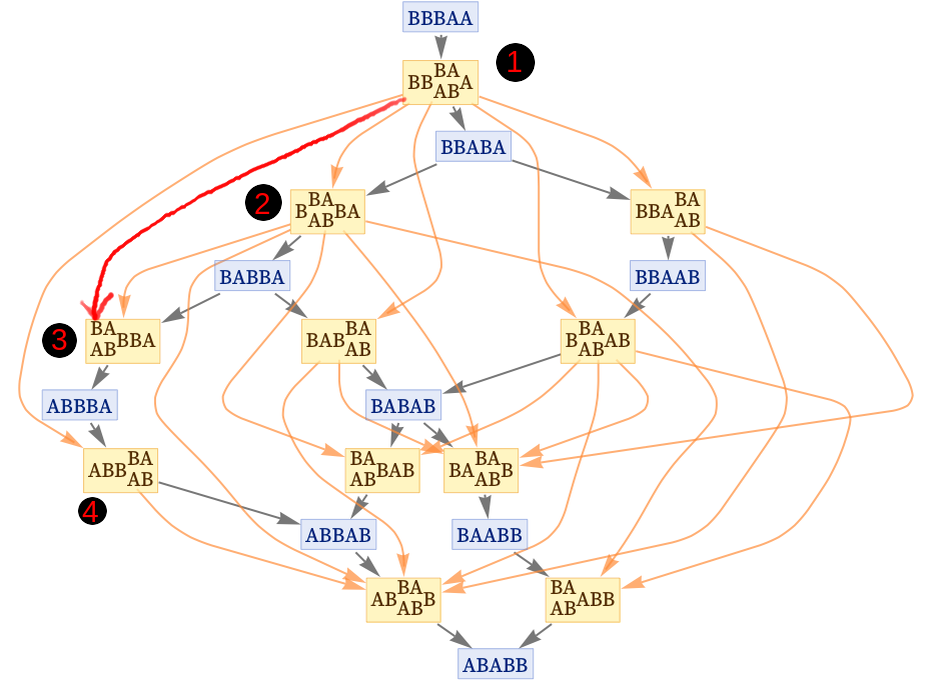
I suggest you take a look at this graph:

It is taken from https://wolframphysics.org/technical-introduction/the-updating-process-for-string-substitution-systems/the-significance-of-causal-invariance/ and has the advantage of being a string substitution system, so it is easier to visualize.
The rule here is simply AB
$\rightarrow$ BA. Look at the leftmost path where I have numbered the events. The red connection between event 1 and event 3 (which I added) is not correct and should not be present, because none of the first two letters of the string BABBA (which are used as input of event 3) are created by event 1.
In fact, the first B (BABBA) was present in the initial state and the A (BABBA) was created by event 2.
Conversely, look at event 4. The input of this event are the last two letters of ABBBA. The last A (ABBBA) comes from the initial state, while the B (ABBBA) was indeed created by event 1. Therefore, since part of the input of event 4 was created by event 1, there must be an orange arrow connecting 1 to 4.
The exact same principle can be applied to the graph that you posted, but it is more difficult to see. If you are not convinced, I suggest you try and draw part of your graph by hand. With some time, you could work out what are the inputs and outputs of each event, and where each node and arc have originated. You should be able to see why the red connections you have drawn are incorrect.
Hope this helps