Message Boards Message Boards

0
|
6159 Views
|
5 Replies
|
2 Total Likes
View groups...
Share
Share this post:

Plot planes in 3D by using the extreme points

Posted 10 years ago
Hello!
Could you please help me with the following problem. Let's say I have the following points in 3D space (q1,q2,C):
(2,3,6)
(3,1,5)
(4,5,15)
(5,2,10)
(0,0,0)
What I want to do is to plot planes where the above points are the extreme points. It should also be such that it only plots the lowest plane if a specific point (q1,q2) lies on severals planes. See the attached picture to understand how the output should look like.


What is the easiest way to make such a plot for arbitrary data (3D)?
Thank you very much for your time and consideration!
Alex
5 Replies
I am unsure if this is what you are looking for, but perhaps it will help:
data3D = {{2, 3, 6},
  {3, 1, 5},
  {4, 5, 15},
  {5, 2, 10},
  {0, 0, 0}
  }

Needs["TetGenLink`"]

Use a convex hull:
{pts, surface} = TetGenConvexHull[data3D];
Graphics3D[GraphicsComplex[pts, Polygon[surface]]]

Write a function that determines the normal of a triangle, which can be applied to pts and surface
normal[xyz_, vertList_] := Block[
  {u, v},
  u = xyz[[vertList[[2]]]] - xyz[[vertList[[1]]]];
  v = xyz[[vertList[[3]]]] - xyz[[vertList[[2]]]];
  Cross[u, v]
  ]

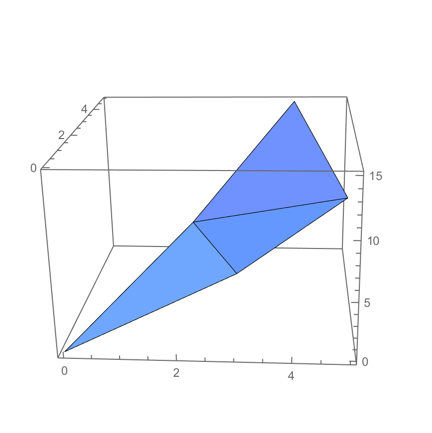
Select only those triangles which have their normals pointing up:
bottomTriangles = Select[surface, (normal[pts, #].{0, 0, 1} > 0) &]

Graphics3D[GraphicsComplex[pts, Polygon[bottomTriangles]],
Axes -> True, BoxRatios -> {1, 1, 2/3}]
POSTED BY: W. Craig Carter
--
Thank you so much! That was exactly what I wanted - and it works for other data as well. I am very very grateful!
Now some time later I thought it could be fantastic to also include a gradient plot of the above figure. I mean a plot similar to this one (2d):

but where we do not have a specific function, but instead the planes defined by the code provided by Mr. Craig Carter (once again, thank you). I would be very grateful if someone could help me with that.

Thank you very much!
Dear Mr. W. Craig Carter

Thank you very much for your answer - it was very very helpful. I was wondering whether it is possible to add a gradient plot (as described in my post below), so that these planes also can be illustrated in another way. I would be very grateful if you could help.

Thank you very much for your time and consideration.
Reply to this discussion
Community posts can be styled and formatted using the Markdown syntax.
Reply Preview
Attachments
Remove
or Discard

Group Abstract Group Abstract