Message Boards Message Boards

0
|
6211 Views
|
5 Replies
|
2 Total Likes
View groups...
Share
Share this post:

Plot planes in 3D by using the extreme points

Posted 11 years ago
Hello!
Could you please help me with the following problem. Let's say I have the following points in 3D space (q1,q2,C):
(2,3,6)
(3,1,5)
(4,5,15)
(5,2,10)
(0,0,0)
What I want to do is to plot planes where the above points are the extreme points. It should also be such that it only plots the lowest plane if a specific point (q1,q2) lies on severals planes. See the attached picture to understand how the output should look like.


What is the easiest way to make such a plot for arbitrary data (3D)?
Thank you very much for your time and consideration!
Alex
5 Replies
Dear Mr. W. Craig Carter

Thank you very much for your answer - it was very very helpful. I was wondering whether it is possible to add a gradient plot (as described in my post below), so that these planes also can be illustrated in another way. I would be very grateful if you could help.

Thank you very much for your time and consideration.
Now some time later I thought it could be fantastic to also include a gradient plot of the above figure. I mean a plot similar to this one (2d):

but where we do not have a specific function, but instead the planes defined by the code provided by Mr. Craig Carter (once again, thank you). I would be very grateful if someone could help me with that.

Thank you very much!
Thank you so much! That was exactly what I wanted - and it works for other data as well. I am very very grateful!
I am unsure if this is what you are looking for, but perhaps it will help:
data3D = {{2, 3, 6},
  {3, 1, 5},
  {4, 5, 15},
  {5, 2, 10},
  {0, 0, 0}
  }

Needs["TetGenLink`"]

Use a convex hull:
{pts, surface} = TetGenConvexHull[data3D];
Graphics3D[GraphicsComplex[pts, Polygon[surface]]]

Write a function that determines the normal of a triangle, which can be applied to pts and surface
normal[xyz_, vertList_] := Block[
  {u, v},
  u = xyz[[vertList[[2]]]] - xyz[[vertList[[1]]]];
  v = xyz[[vertList[[3]]]] - xyz[[vertList[[2]]]];
  Cross[u, v]
  ]

Select only those triangles which have their normals pointing up:
bottomTriangles = Select[surface, (normal[pts, #].{0, 0, 1} > 0) &]

Graphics3D[GraphicsComplex[pts, Polygon[bottomTriangles]],
Axes -> True, BoxRatios -> {1, 1, 2/3}]
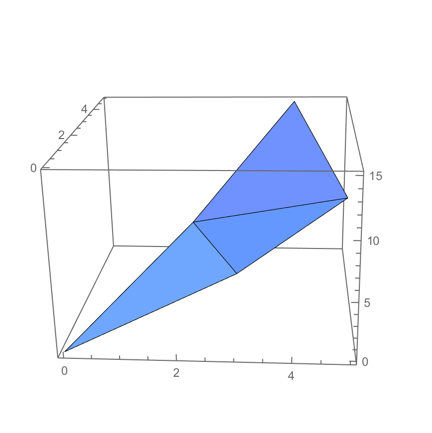
POSTED BY: W. Craig Carter
--
Reply to this discussion
Community posts can be styled and formatted using the Markdown syntax.
Reply Preview
Attachments
Remove
or Discard

Group Abstract Group Abstract