Group Abstract Group Abstract

Message Boards Message Boards

2
|
10.1K Views
|
3 Replies
|
3 Total Likes
View groups...
Share
Share this post:

Why ANOVATable does not show the F-Statistic and P value for NonlinearModel

POSTED BY: Diego Ramos
3 Replies

I agree. Yes you can reconstruct it, but why should you have to? Perhaps an ANOVAAssociation property could be added that included this information. Also, in general the various "...Table" properties of the FittedModel and related objects should be augmented by "...Association" properties or "..."Dataset" that describe the statistic using a key value pair.

POSTED BY: Seth Chandler
Posted 5 years ago

As I think you already know when using LinearModelFit the F-statistic and associated P-value show up but I don't know why that isn't included in the "ANOVATable" for NonlinearModelFit. However, the "ANOVATable" gets you the overall model information from which you can construct the F-statistic and associated P-value for the overall model:

data = {{0, 1}, {1, 0}, {3, 2}, {5, 4}, {6, 4}, {7, 5}};
nlm = NonlinearModelFit[data, Log[a + b x^2], {a, b}, x];
nlm["ANOVATable"]

ANOVATable

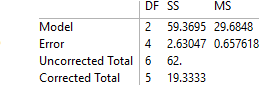
anova = nlm["ANOVATableEntries"];
FStatistic = anova[[1, 3]]/anova[[2, 3]]
(* 45.1398 *)
Pvalue = 1 - CDF[FRatioDistribution[anova[[1, 1]], anova[[2, 1]]], FStatistic]
(* 0.00180005 *)

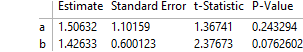
What is probably more interesting is to obtain the t-values and associated P-values for the individual parameters:

nlm["ParameterTable"]

ParameterTable

POSTED BY: Jim Baldwin
POSTED BY: Diego Ramos
Reply to this discussion
Community posts can be styled and formatted using the Markdown syntax.
Reply Preview
Attachments
Remove
or Discard