Dear all,
in my code above I calculated the derivative like so:
deriv0 = Differences[mfts]; (* quick and dirty method! *)
and yes - maybe this is a bit too quick and dirty! But TimeSeries has a lot of nice properties to offer: E.g. "PathFunction" gives an InterpolatingFunction, from which easily the derivative can be calculated:
Plot[mfts["PathFunction"]'[t], {t, mfts["FirstTime"], mfts["LastTime"]}, ImageSize -> Large, GridLines -> Automatic]
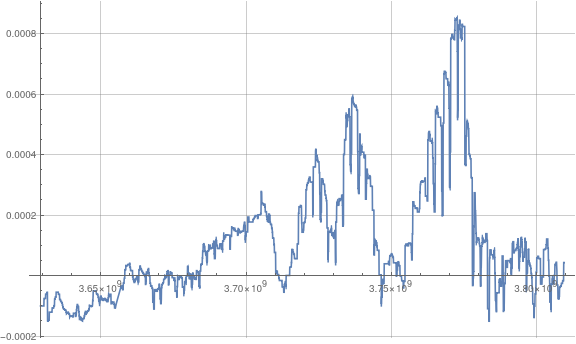
Here the abscissa is in terms of AbsoluteTime, i.e. the number of seconds starting from 01.01.1900. Consequently the unit of the derivative is (unit of your data)/seconds.
This then can be resampled (here e.g. in 3-day-interval) and converted back into a TimeSeries for further smoothing:
sampleDates = DateRange[FromAbsoluteTime@mfts["FirstTime"], FromAbsoluteTime@mfts["LastTime"], Quantity[3, "Days"]];
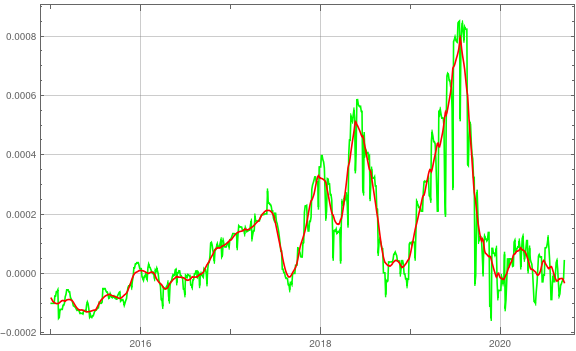
deriv = TimeSeries[{#, mfts["PathFunction"]'[AbsoluteTime@#]} & /@ sampleDates];
derivSmooth = MeanFilter[deriv, Quantity[4, "Weeks"]];
DateListPlot[{deriv, derivSmooth}, ImageSize -> Large, GridLines -> Automatic, PlotStyle -> {Green, Red}]
This definitely is a cleaner solution. Regards -- Henrik


