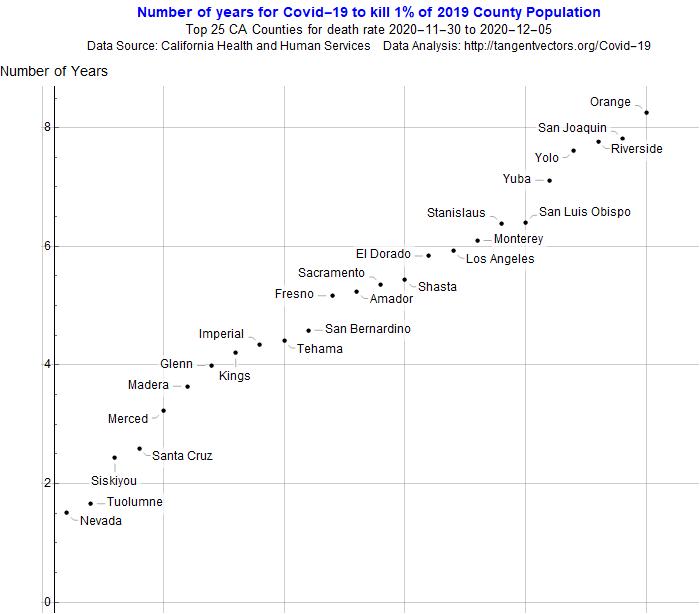
Hi Mads! I see you're just a short jump up the road in Los Angeles. We are lucky to have such rich sources of data here at the State, County, and Municipal levels. One way to help residents understand it is in terms of how fast it's affecting their population. Here's an example with death rates, but I think you could adapt the idea to infection rates:
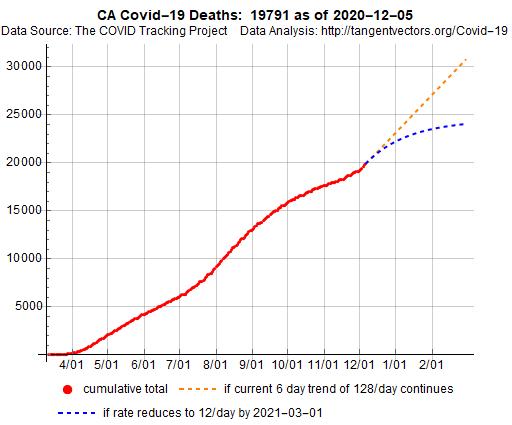
Another approach that seems work are charts of actual data with modeled projections - one portraying the current trend and another with a very optimistic trend: