Message Boards Message Boards

0
|
4951 Views
|
3 Replies
|
5 Total Likes
View groups...
Share
Share this post:

PlotLegends problem with ParallelAxisPlot

Posted 3 years ago

I was looking at the new plotting functions in Version 12.2 and tried them out on a comparison of the dimensions and weight of various cameras. PlotLegends behaves as expected with RadialAxisPlot but not with ParallelAxisPlot. Does anyone have any insight into this?

cameras =
  {"Sony a7", "Sony a7 ii", "Sony a7 iii", "Nikon D700", "Nikon Z6", 
   "Nikon Z6 ii", "Sony a7c", "EOS R6", "Nikon D750"};

header = {"weight", "width", "height", "thickness"};

data = {{14.67, 5., 3.75, 2.25}, {19.61, 4.99, 3.76, 2.35}, 
    {24.5, 5., 3.875, 3.}, {35., 5.8, 4.8, 3.}, 
    {20.7, 5.3, 4., 2.7}, {21.7, 5.3, 4., 2.8}, 
    {18., 4.88, 2.8, 2.35}, {24., 5.45, 3.84, 3.46}, 
    {29.7, 5.6, 4.5, 3.1}}; 

rPlot = RadialAxisPlot[data, PlotRange -> All, AxesLabel -> header, 
  PlotLegends -> cameras, Filling -> None, ImageSize -> 300]
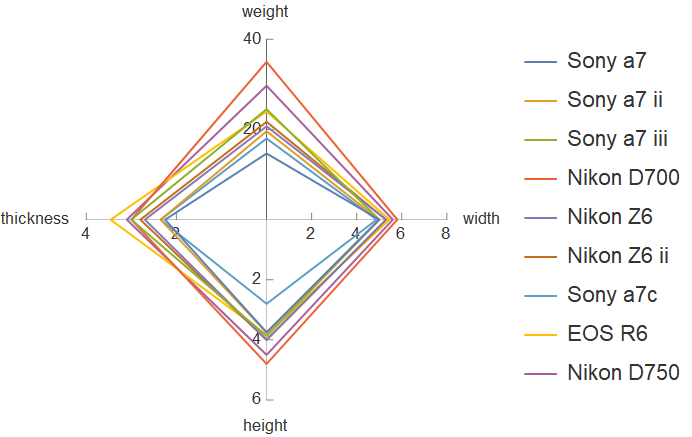
radialaxisplot

pPlot = ParallelAxisPlot[data, PlotRange -> All, AxesLabel -> header, 
  PlotLegends -> cameras, ImageSize -> 300]
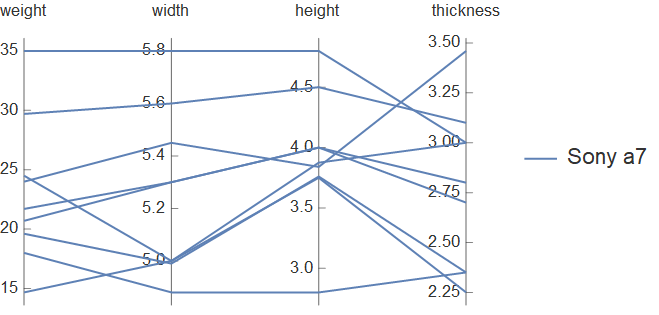
enter image description here

POSTED BY: David Keith
3 Replies

Right, so you could do something like:

ParallelAxisPlot[{data[[{1, 2, 3, 7}]], data[[{4, 5, 6, 9}]], data[[{8}]]}, 
   AxesLabel -> header, PlotLegends -> {"Sony", "Nikon", "Canon"}]

enter image description here

and see that the Sony cameras you're looking at are generally lighter and smaller than the Nikons and the Canon.

POSTED BY: Brett Champion
Posted 3 years ago

Thank you very much, Brett. If I understand you, and in re-reading the docs, if ParallelAxisPlot is given a list, it expects each element at the top level to be a list of n-dimensional points. Following this, I modified my data so that each element at the top level contained a list of exactly one point. This does exactly what I wanted:

transformedData = List /@ data;

pPlot2 = ParallelAxisPlot[transformedData, PlotRange -> All, 
  AxesLabel -> header, PlotLegends -> cameras, ImageSize -> 300]

pplot2

And I do believe I see the rationale for this approach. Each list of points can represent a set of data. And sets of data can be compared.

POSTED BY: David Keith

RadialAxisPlot and ParallelAxisPlot, are conceptually very similar, but in practice tend to be used differently. Radial plots are generally used with relatively few points[1] to make direct comparisons between them. Parallel plots are used with more points to detect clusters, trends, and outlying cases.

RadialAxisPlot's documentation emphasizes using it with either a single point, or a list of points, which then each get their own styles. ParallelAxisPlot on the other hand is documented to work with a set of points or a list of sets of points, and the styles are done per set.

[1] By "point" I mean an n-dimensional point, which is visualized as a polygon or line by the respective functions.

POSTED BY: Brett Champion
Reply to this discussion
Community posts can be styled and formatted using the Markdown syntax.
Reply Preview
Attachments
Remove
or Discard

Group Abstract Group Abstract