I was looking at the new plotting functions in Version 12.2 and tried them out on a comparison of the dimensions and weight of various cameras. PlotLegends behaves as expected with RadialAxisPlot but not with ParallelAxisPlot. Does anyone have any insight into this?
cameras =
{"Sony a7", "Sony a7 ii", "Sony a7 iii", "Nikon D700", "Nikon Z6",
"Nikon Z6 ii", "Sony a7c", "EOS R6", "Nikon D750"};
header = {"weight", "width", "height", "thickness"};
data = {{14.67, 5., 3.75, 2.25}, {19.61, 4.99, 3.76, 2.35},
{24.5, 5., 3.875, 3.}, {35., 5.8, 4.8, 3.},
{20.7, 5.3, 4., 2.7}, {21.7, 5.3, 4., 2.8},
{18., 4.88, 2.8, 2.35}, {24., 5.45, 3.84, 3.46},
{29.7, 5.6, 4.5, 3.1}};
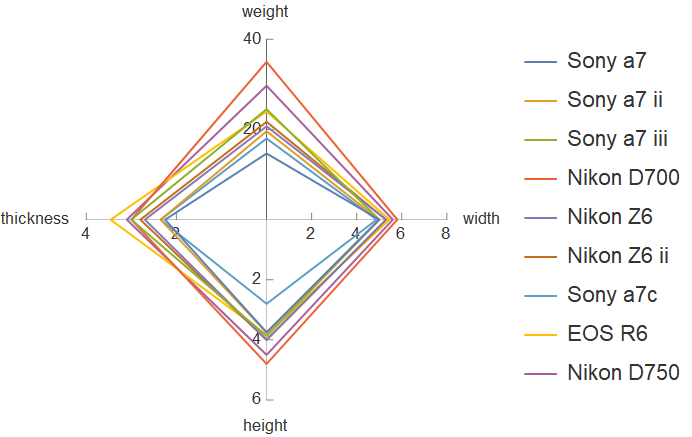
rPlot = RadialAxisPlot[data, PlotRange -> All, AxesLabel -> header,
PlotLegends -> cameras, Filling -> None, ImageSize -> 300]
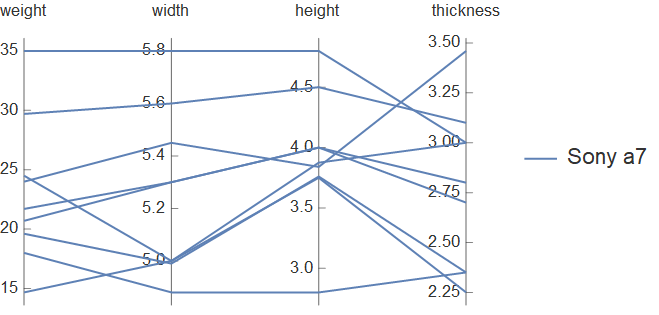
pPlot = ParallelAxisPlot[data, PlotRange -> All, AxesLabel -> header,
  PlotLegends -> cameras, ImageSize -> 300]