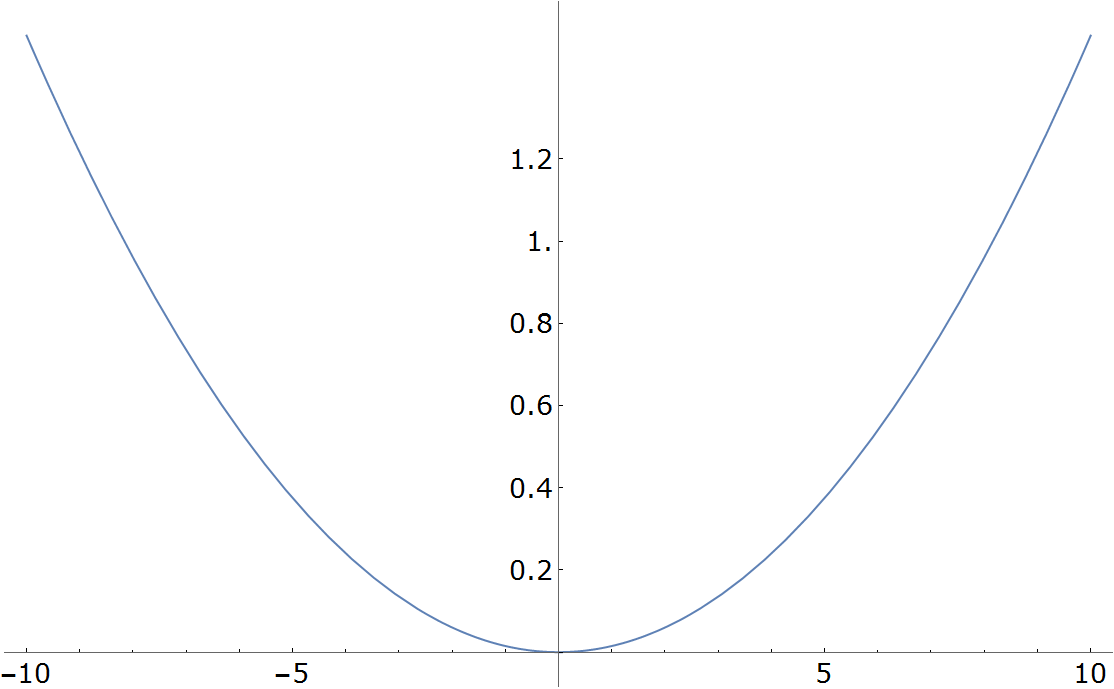
I have the following plot with its Ticks:

Notice the 1. vertical axis tick. I want to change it to 1.
The plot was generated in the following way:
Plot[
 0.015 x^2, {x, -10, 10},
 Ticks -> {Automatic, Table[{j, j}, {j, 0, 1.2, 0.2}]}]
Any suggestion would be very helpful!