Message Boards Message Boards

0
|
2433 Views
|
2 Replies
|
1 Total Likes
View groups...
Share
Share this post:

Change `1.` to `1` in plot ticks

Posted 4 years ago

I have the following plot with its Ticks:
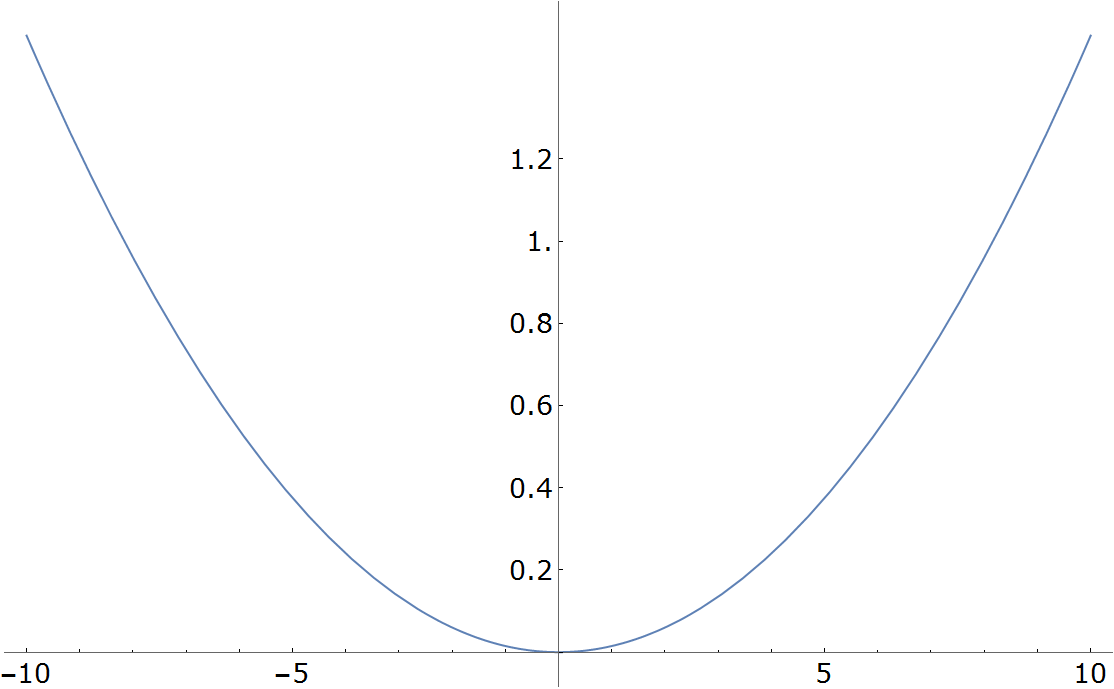
enter image description here

Notice the 1. vertical axis tick. I want to change it to 1.

The plot was generated in the following way:

Plot[
 0.015 x^2, {x, -10, 10},
 Ticks -> {Automatic, Table[{j, j}, {j, 0, 1.2, 0.2}]}]

Any suggestion would be very helpful!

POSTED BY: Ehud Behar
2 Replies

Hi Ehud

Try that

Plot[0.015 x^2, {x, -10, 10}, 
 Ticks -> {Automatic, Table[j, {j, 0, 1.2, 0.2}] /. 1. -> 1}]
POSTED BY: Ahmed Elbanna
Posted 4 years ago

Neat!

Thanks a lot!

POSTED BY: Ehud Behar
Reply to this discussion
Community posts can be styled and formatted using the Markdown syntax.
Reply Preview
Attachments
Remove
or Discard

Group Abstract Group Abstract