I'd like to create an illustration with Mathematica to show the flow of data in a suite of programs. In particular, I'd like to use names instead of points for vertices.
Here's some example metadata, selected from what is automatically generated by the program suite:
columnDefs = {"Program", "Input Files", "Output Files"};
suitedata = {{"Spatial to Spectral", {"Spatial Profiles",
     "Enhanced Spatial Profiles"}, {"Alleles Frequencies Profiles",
     "Enhanced Alleles Frequencies Profiles"}},
   {"Profile Enrichment", {"Spatial Profiles"}, {"Enhanced Spatial \
Profiles"}},
   {"Distance Properties", {"Spatial Profiles",
     "Alleles Frequencies Profiles"}, {"Distances"}},
   {"Distance Properties", {"Spatial Profiles",
     "Alleles Frequencies Profiles"}, {"Distances"}}};
edges = DeleteDuplicates[Flatten[
    Table[
     {
      Table[suitedata[[p, 2, i]] \[DirectedEdge] suitedata[[p, 1]],
       {i, 1, Length[suitedata[[p, 2]]]}
       ],
      Table[suitedata[[p, 1]] \[DirectedEdge] suitedata[[p, 3, j]],
       {j, 1, Length[suitedata[[p, 3]]]}
       ]
      },
     {p, 1, Length[suitedata]}
     ]
    , 2]];
vertices = Sort[DeleteDuplicates[Flatten[suitedata]]];
vertexLabels = # -> Framed[#] & /@ vertices;
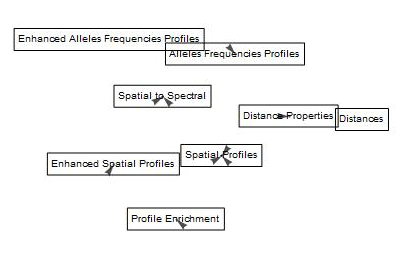
So that's the easy part. I've been failing at rendering them in a Graph.
Graph[edges, EdgeStyle -> Black, VertexLabels -> None,
 VertexShape -> vertexLabels, VertexSize -> {2, 0.5},
 VertexStyle -> Black, GraphLayout -> "SpringEmbedding",
 ImageSize -> Large]