Message Boards Message Boards

0
|
3620 Views
|
9 Replies
|
1 Total Likes
View groups...
Share
Share this post:

Create 3D plot of paths defined point to point?

I'd like to create a 3D plot of several paths defined by points. What's the best way?

Say I have three vectors, x,y,z with integer xi, yi, zi elements, and want to make a 3D plot of a curve composed of segments that connect (x1,y1,z1) to (x2,y2,z2) to (x3,y3,z3) to ...

Please word an answer for someone of below average intelligence who has just started learning Mathematica.

Once I get past that hurdle, I think I can figure out the rest on my own. But if your feeling generous,... I will next want to overlay several such curves in different colors on the same plot. For example where the x,y,z vectors above are columns in matrices X,Y,Z.

For context, I want to illustrate diffusion in 3D by tracking some number of molecules random-walking from the origin in discrete steps.

And if you're really feeling generous, I'd like to put a slider on the plot for the number of steps.

The main question here though is only where to start. What plot command will allow me to do what I want to do.

POSTED BY: Jay Gourley
9 Replies

Thanks, Rohit. I didn't even know AnglePath3D existed. This community is great. I'll get back to this thread after I've had a chance to implement these ideas later today.

POSTED BY: Jay Gourley

Thanks, Rohit.

I was wondering what DynamicModule[] does. The documentation didn't make sense until I saw how you used it. If you don't know what the function is trying to do, it's hard to understand the documentation that tells you how to do that. As they say, if you don't know where you're going, any road will get you there. The DynamicModule[] documentation makes sense now.

The disappearing trails also keeps the time steps uniform since Mathematica doesn't have to do as much addition. Otherwise the model would start to slow down on my i7 after a few thousand steps.

The purpose is to give visual confirmation to an algebraic derivation of the diffusion equatioin from obvious logic of a random walk using average mean clear path.

I would never have tried to tackle Mathematica were it not for this commnity.

POSTED BY: Jay Gourley
Posted 3 years ago

Or, if you want straight lines joining the points rather than Henrik's nice interpolation.

Generate 5 3D paths with 1000 steps each using AnglePath3D. If you already have the list of points then this is not needed.

SeedRandom[123];   
randomPaths = Table[RandomReal[{-2 Pi, 2 Pi}, {1000, 3}], 5] // Map[AnglePath3D];

Colors for a path

colors = ColorData[112, "ColorList"];
color[n_] := colors[[Max[Mod[n, Length@colors], 1]]]

Plot the paths

Graphics3D[MapIndexed[{color@First@#2, Line[#1]} &, randomPaths], ViewPoint -> {0, 0, 2}]

enter image description here

POSTED BY: Rohit Namjoshi

This works great, Rohit. Thanks again. I'm still looking for a couple of solutions. If you know where I can find them, please reply. The two improvements I'm trying to make are,...

  1. Lock the scale of the box so that comparison is possible. As you see from the slider in my code. I'm trying to illustrate the change that occurs as the number of steps changes. But the automatic scaling in Mathematica defeats that.

  2. I think it might be possible for the graphic to change as a fluid picture when the slider moves. The notebook pasted below requires the graphic to be recalculated from the keyboard after every change of the slider.

POSTED BY: Jay Gourley

Thanks again, Rohit. Thanks to your help, I figured it out and got the model to look like I wanted (attached). The idea is to illustrate a random-walk derivation of the diffusion equation,.

Attachments:
POSTED BY: Jay Gourley
Posted 3 years ago

Cool!. I like the disappearing effect. Simpler version with no disappearing

DynamicModule[{nPaths, nSteps, randomPaths, colors, color},
 nPaths = 10;
 nSteps = 125;
 SeedRandom[123];
 randomPaths = 
  Table[(RandomInteger[{0, 1}, {nSteps, 3}] - 1/2) 2, nPaths] // Map[AnglePath3D];
 colors = ColorData[112, "ColorList"];
 color[n_] := colors[[Max[Mod[n, Length@colors], 1]]];
 Manipulate[
  Graphics3D[
   MapIndexed[({color@First@#2, Line[#1[[1 ;; ns]]]} &), randomPaths],
    ViewPoint -> {5, 6, 3}, Boxed -> True, BoxStyle -> Opacity[.25], 
   PlotRange -> {{-15, 15}, {-15, 15}, {-15, 15}}], {ns, 2, nSteps, 1,
    AnimationRate -> 10, AnimationRepetitions -> 1, 
   AnimationRunning -> True, Appearance -> "Open"}]]

enter image description here

POSTED BY: Rohit Namjoshi

Jay,

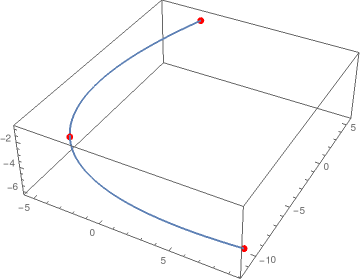
my suggestion for this (if I understand your question correctly) would be using interpolation of these points - and here in particular ListInterpolation, because then you can set identical parametric limits on all line segments (here e.g. {0, 1}). My simple code (I do assume you have access to the documentation ...):

(* choosing 3 random vectors: *)

pts = RandomInteger[{-10, 10}, {3, 3}];
(* creating InterpolatingFunctions for each component; when you have \
only 3 points you can at most use 2 for 'InterpolationOrder: *)

ipLine = ListInterpolation[#, {0, 1}, InterpolationOrder -> 2] & /@ Transpose[pts];
(* showing the result - together with the original points: *)
Show[ParametricPlot3D[Through[ipLine[t]], {t, 0, 1}], Graphics3D[{Red, PointSize[Large], Point[pts]}]]
enter image description here

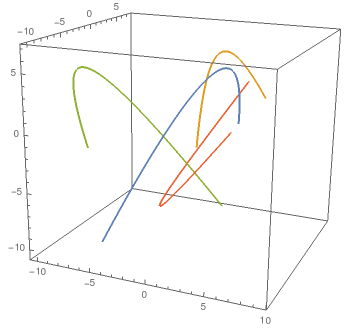
When doing this for more sets of points it makes sense defining a function, e.g.:

lineFunc[t_][pts_List] := Module[{func3},
  func3 = ListInterpolation[#, {0, 1}, InterpolationOrder -> 2] & /@ Transpose[pts];
  Through[func3[t]]
  ]

and using this function:

(* e.g. creating 4 sets of 3 points: *)
{pts1, pts2, pts3, pts4} = Partition[RandomInteger[{-10, 10}, {12, 3}], 3];
(* and showing the result:  *)
ParametricPlot3D[Evaluate[lineFunc[t] /@ {pts1, pts2, pts3, pts4}], {t, 0, 1}]
enter image description here

Does that help? Regards -- Henrik

POSTED BY: Henrik Schachner

Yes, that helps, Henrik. Thanks. I don't know why but ListInterpolation[] never crossed my browser when I was considering the functions that almost did what I wanted. I'll get back to this thread after I've had a chance to try this out later today.

POSTED BY: Jay Gourley
Posted 3 years ago

Did you check out Plot3D[]?

POSTED BY: Mike Besso
Reply to this discussion
Community posts can be styled and formatted using the Markdown syntax.
Reply Preview
Attachments
Remove
or Discard

Group Abstract Group Abstract