Jay,
my suggestion for this (if I understand your question correctly) would be using interpolation of these points - and here in particular ListInterpolation, because then you can set identical parametric limits on all line segments (here e.g. {0, 1}). My simple code (I do assume you have access to the documentation ...):
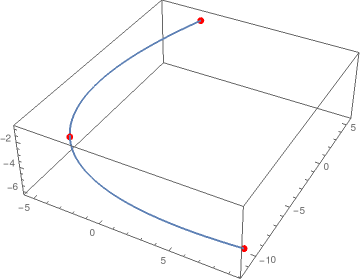
(* choosing 3 random vectors: *)

pts = RandomInteger[{-10, 10}, {3, 3}];
(* creating InterpolatingFunctions for each component; when you have \
only 3 points you can at most use 2 for 'InterpolationOrder: *)

ipLine = ListInterpolation[#, {0, 1}, InterpolationOrder -> 2] & /@ Transpose[pts];
(* showing the result - together with the original points: *)
Show[ParametricPlot3D[Through[ipLine[t]], {t, 0, 1}], Graphics3D[{Red, PointSize[Large], Point[pts]}]]
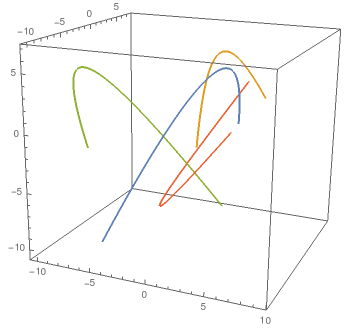
When doing this for more sets of points it makes sense defining a function, e.g.:
lineFunc[t_][pts_List] := Module[{func3},
  func3 = ListInterpolation[#, {0, 1}, InterpolationOrder -> 2] & /@ Transpose[pts];
  Through[func3[t]]
  ]
and using this function:
(* e.g. creating 4 sets of 3 points: *)
{pts1, pts2, pts3, pts4} = Partition[RandomInteger[{-10, 10}, {12, 3}], 3];
(* and showing the result:  *)
ParametricPlot3D[Evaluate[lineFunc[t] /@ {pts1, pts2, pts3, pts4}], {t, 0, 1}]
Does that help? Regards -- Henrik


