I want to draw some points and lines with ListPlot. Some points shall be marked individually. Unfortunatly this does not work as expected. At the end of this article I present a solution with two ListPlots. But this is not very elegant. Does anybody have a better idea?
(I use 1 singular point and two lines within the following code).
The standard use of PlotMarkers marks pointsets, i.e. the singular point and the two lines, not individual points:
If[True, Block[{lines, markers, cols = {Red, Green, Blue}},
  lines = {{{0.5, 1}}, {{1, 2}, {2, 1}}, {{0, 0}, {1, 1}}};
  markers = Style[#, Bold, Larger] & /@ {"A", "B", "C"};
  Echo[Column[{lines, markers, cols}], "lines,markers,cols: "];
  ListPlot[lines, Joined -> True, PlotMarkers -> markers,
   PlotStyle -> cols,
   PlotRangePadding -> 0.5, ImageSize -> Small]
  ]]

I would expect that individual points can be marked by giving the markers the same list-structure as the lines. But this leads to errors and a wrong result. Obviously the structure of markers has to be flat and is unrelated to the structure of lines.
If[True, Block[{lines, markers, cols = {Red, Green, Blue}},
  lines = {{{0.5, 1}}, {{1, 2}, {2, 1}}, {{0, 0}, {1, 1}}};
  markers =
   Map[Style[#, Bold, Larger] &, {{"A"}, {"B1", "B2"}, {"C1",
      "C2"}}, {2}];
  Echo[Column[{lines, markers, cols}], "lines,markers,cols: "];
  ListPlot[lines, Joined -> True, PlotMarkers -> markers,
   PlotStyle -> cols,
   PlotRangePadding -> 0.5, ImageSize -> Small]
  ]]
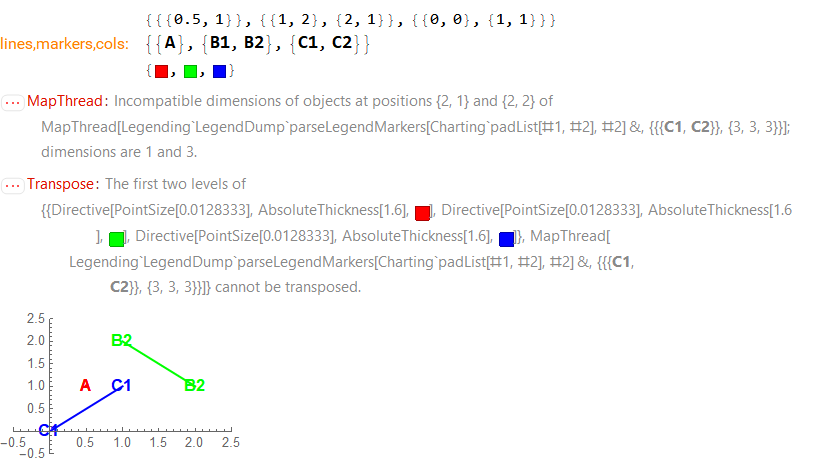
The next example looks similar, but actually the markers-structure is changed to flat with lists as elements:
If[True, Block[{lines, markers, cols = {Red, Green, Blue}},
  lines = {{{0.5, 1}}, {{1, 2}, {2, 1}}, {{0, 0}, {1, 1}}};
  markers =
   Style[#, Bold, Larger] & /@ {{"A"}, {"B1", "B2"}, {"C1", "C2"}};
  Echo[Column[{lines, markers, cols}], "lines,markers,cols: "];
  ListPlot[lines, Joined -> True, PlotMarkers -> markers,
   PlotStyle -> cols,
   PlotRangePadding -> 0.5, ImageSize -> Small]
  ]]

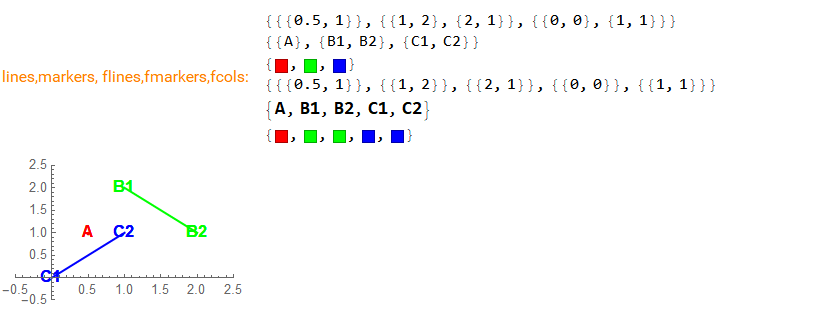
Hence the only solution is to Show two ListPlots. One for the lines as before and one for the flattened points.
If[True, Block[{lines, markers, flines, fmarkers,
   cols = {Red, Green, Blue}, fcols},
  lines = {{{0.5, 1}}, {{1, 2}, {2, 1}}, {{0, 0}, {1, 1}}};
  markers = {{"A"}, {"B1", "B2"}, {"C1", "C2"}};
  flines = Flatten[lines, 1];
  flines = {#} & /@ flines;
  fmarkers = Style[#, Bold, Larger] & /@ Flatten[markers];
  fcols =
   First[StringReplace[#, {"A" ~~ ___ -> cols[[1]],
        "B" ~~ ___ -> cols[[2]], "C" ~~ ___ -> cols[[3]]}]] & /@
    Flatten[markers];
  Echo[Column[{lines, markers, cols, flines, fmarkers, fcols}],
   "lines,markers, flines,fmarkers,fcols: "];
  Show[
   ListPlot[lines, Joined -> True, PlotStyle -> cols],
   ListPlot[flines, PlotMarkers -> fmarkers, PlotStyle -> fcols],
   PlotRangePadding -> 0.5, ImageSize -> Small
   ]
  ]]
 Attachments:


