Hi Eric,
Interpolating is probably not a good idea. Here is one way to compute the mean and standard deviation of stress and strain for the three sheets in the Excel file.
(* Import data from the first 3 sheets *)
data = Import["~/Downloads/Test_Data.xlsx", {"Dataset", 1 ;; 3, All, 5 ;; 6},
         HeaderLines -> 1]

(* Compute mean and standard deviation of stress and strain *)
meanStddev = #[All, {"Strain", "Stress"}] & /* Normal /* Values /*
              (Through[{Mean, StandardDeviation}[#]] &) /* Transpose /@ data

(*
{{{0.403469, 0.240323}, {10.729, 5.34928}},
{{0.344623, 0.192363}, {10.6931, 5.29}},
{{0.325966, 0.199726}, {12.3087, 6.00161}}}
*)
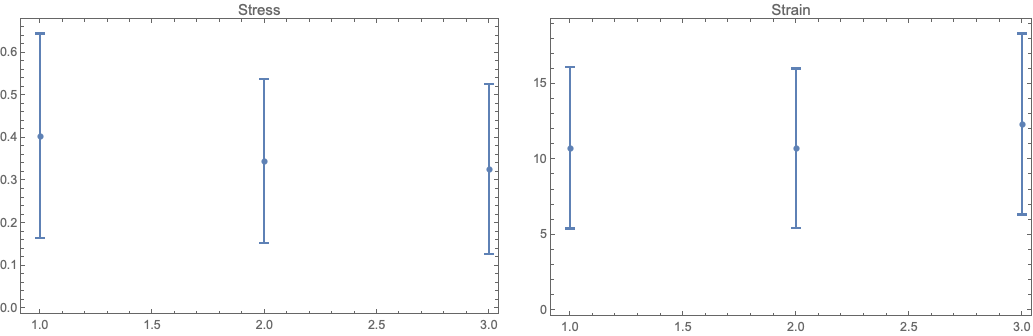
Not sure how you want to present the data. Here is one way. The horizontal axis is the dataset number (sheet) and the vertical axis is the mean with error bars corresponding to +/- standard deviation
Apply[Around, meanStddev, {2}] // Transpose //
  MapThread[
    ListPlot[#1, PlotLabel -> #2, Frame -> True, ImageSize -> 400,
      PlotRange -> All] &, {#, {"Stress", "Strain"}}] & //
 Row[#, Spacer[20]] &
Usually for stress and strain they are plotted against each other to estimate Young's modulus (bu fitting a straight line) and yield strength. Mean and standard deviation don'r reveal much.


