Eric,
your data have different values for the abscissa. In those cases I find TemporalData quite handy - this I use in combination with Around:
fn = "Test_Data.xlsx";
sheets = Import[fn, "Data"];
tData = TemporalData[rawData = sheets[[All, 2 ;;, {-2, -1}]]];
stress[strain_] := With[{sld = tData["SliceData", strain]}, Around[Mean[sld], StandardDeviation[sld]]]
With this simple function you already can do things like:

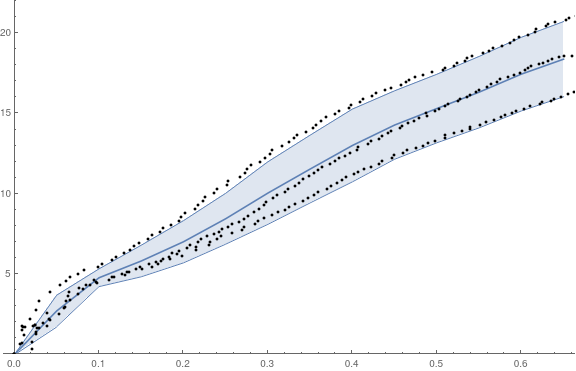
and those values can be plotted:
ListLinePlot[Table[{Around[strain, 0.000001], stress[strain]}, {strain, 0, .65, .05}], IntervalMarkers -> "Bands", PlotRange -> {0, 22}, Epilog -> {Point /@ rawData }, ImageSize -> Large]

The statistics is made of just three values here, and so we see the somewhat strange effect that some data points are outside of the "band". Does that help? Regards -- Henrik