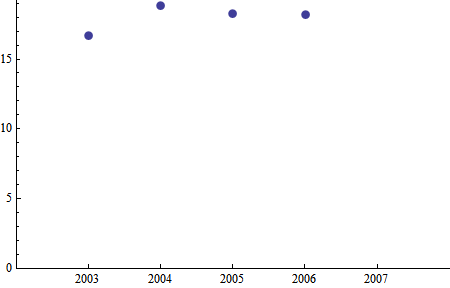
Hi GA,
In making an estimate like this, it is necessary to make assumptions about the population from which the data is drawn.
For example, you could assume that all of these samples were drawn fron a normal distribution, meaning the expectation is not changing over time. There is nothing in your data to contradict this. In this case, the best estimate is the sample mean and the standard deviation provides a probability of findng another sample within some distance of the mean.
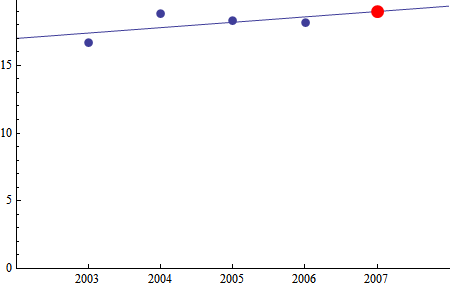
On the other hand, if you want to assume the expected values are changing over time, then what you have is a curve fitting problem. Any finite data set can be made to perfectly fit a polynomial. Such a fit is not very useful. For a fit to be a good tool, it should be based on some reasonable a prori assumption regarding the function to be fit. For example, if we assume your data represents an linear change in expected value over time, then we get the fit seen in the example below. But note that that fit predicts an upward trend, which is entirely due to the low first value, and contradicts the trend line of the last 3 data points.
Generally speaking, unless you have some a priori knowledge of the functional form you expect the data to fit, I doubt there is much that is useful which can be said statistically regarding these data. There are too few points to provide reliable statistics.
Best regards,
David
(* input data *)
data = {{2003, 16.7}, {2004, 18.8}, {2005, 18.28}, {2006, 18.2}};
(* plot it *)
dataPlot =
ListPlot[data, PlotRange -> {{2002, 2008}, {0, All}},
Ticks -> {Range[2003, 2007, 1] // Evaluate, Automatic},
PlotStyle -> PointSize[.02]]

(* the mean and std dev may be the best estimator *)
(* remove semicolons to see result *)
Mean[data[[All, 2]]];
StandardDeviation[data[[All, 2]]];
(* we could assume a linear fit *)
score[y_] = Fit[data, {1, y}, y];
(* by that fit, this is the estimate for 2007 *)
score[2007];
(* plot the data, fit, and estimate *)
(* and don't bet your life savings on it *)
Show[dataPlot, Plot[score[y], {y, 2002, 2008}],
ListPlot[{{2007, score[2007]}},
PlotStyle -> Directive[{Red, PointSize[0.03]}]]]
