Message Boards Message Boards

0
|
5817 Views
|
9 Replies
|
2 Total Likes
View groups...
Share
Share this post:

How to estimate a value due to statistics?

Posted 10 years ago
Hello!

I'm new to wolphram and a little bit slowheaded. Maybe this problem can't be solved but i would like to know how to enter this problem in the Wolphram search bar.
I've tried with fit and many things. I would like to estimate a value with help of statistics.

I wan't to know the test results for the pilot program. I have the following statistics.
How do i estimate the test result value for 2007 with help of the statistics? Can i create a function to do this? If the problem i unsolvable, please tell me why.

2003:
Lowest test results that was accepted: 16.70 points
People that made the tests: 146
Number of people that was accepted to the program: 130
Possible students that are allowed to search based on population: 580 477

2004:
Lowest test results that was accepted: 18.80 points
People that made the tests: 160
Number of people that was accepted to the program: 110
Possible students that are allowed to search based on population: 598 626

2005
Lowest test results that was accepted: 18.28 points
People that made the tests: 196
Number of people that was accepted to the program: 110
Possible students that are allowed to search based on population: 604 544

2006:
Lowest test results that was accepted: 18.2 points
People that made the tests: 160
Number of people that was accepted to the program: 110
Possible students that are allowed to search based on population: 600 778

2007:
Lowest test results that was accepted: X points
People that made the tests: 210
Number of people that was accepted to the program: ?
Possible students that are allowed to search based on population: 580 262.
POSTED BY: G A
9 Replies
Posted 10 years ago
Are there a way to do this with Polynomial interpolation or least squares? I would like to create a function to calculate estimated 2007 lowest test result.
POSTED BY: G A
Posted 10 years ago
Hi GA,

In making an estimate like this, it is necessary to make assumptions about the population from which the data is drawn.

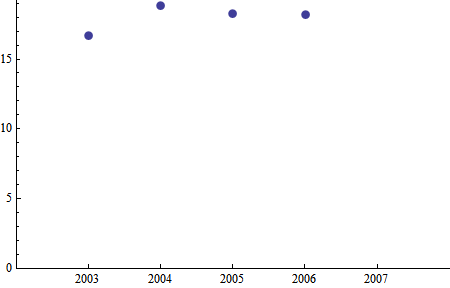
For example, you could assume that all of these samples were drawn fron a normal distribution, meaning the expectation is not changing over time. There is nothing in your data to contradict this. In this case, the best estimate is the sample mean and the standard deviation provides a probability of findng another sample within some distance of the mean.

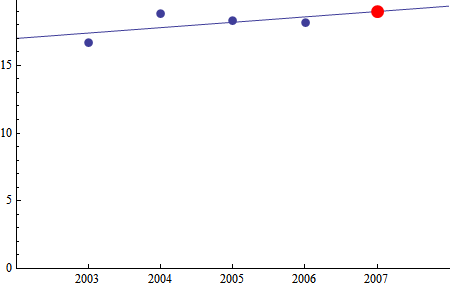
On the other hand, if you want to assume the expected values are changing over time, then what you have is a curve fitting problem. Any finite data set can be made to perfectly fit a polynomial. Such a fit is not very useful. For a fit to be a good tool, it should be based on some reasonable a prori assumption regarding the function to be fit. For example, if we assume your data represents an linear change in expected value over time, then we get the fit seen in the example below. But note that that fit predicts an upward trend, which is entirely due to the low first value, and contradicts the trend line of the last 3 data points.

Generally speaking, unless you have some a priori knowledge of the functional form you expect the data to fit, I doubt there is much that is useful which can be said statistically regarding these data. There are too few points to provide reliable statistics.

Best regards,
David

(* input data *)
data = {{2003, 16.7}, {2004, 18.8}, {2005, 18.28}, {2006, 18.2}};

(* plot it *)
dataPlot =
ListPlot[data, PlotRange -> {{2002, 2008}, {0, All}},
  Ticks -> {Range[2003, 2007, 1] // Evaluate, Automatic},
  PlotStyle -> PointSize[.02]]


 (* the mean and std dev may be the best estimator *)
 (* remove semicolons to see result *)
 Mean[data[[All, 2]]];
 
 StandardDeviation[data[[All, 2]]];
 
 (* we could assume a linear fit *)
 score[y_] = Fit[data, {1, y}, y];
 
(* by that fit, this is the estimate for 2007 *)
score[2007];

(* plot the data, fit, and estimate *)
(* and don't bet your life savings on it *)
Show[dataPlot, Plot[score[y], {y, 2002, 2008}],
ListPlot[{{2007, score[2007]}},
  PlotStyle -> Directive[{Red, PointSize[0.03]}]]]

POSTED BY: David Keith
Hi David,
Thanks a lot, very usefull for my codes.
Question, can we also combine with 'Weighted Moving Average' ?
POSTED BY: Jos Klaps
Posted 10 years ago
Sure,but the MovingAverage will reduce the points to those representing an entire interval.
 In[8]:= data
 
 Out[8]= {{2003, 16.7}, {2004, 18.8}, {2005, 18.28}, {2006, 18.2}}
 
 In[10]:= MovingAverage[data[[All, 2]], {1, 2, 1}]
 
 Out[10]= {18.145, 18.39}
 
 In[11]:= MovingAverage[{a, b, c, d}, {1, 2, 1}]

Out[11]= {a/4 + b/2 + c/4, b/4 + c/2 + d/4}

I worked with just the Y-values, but you can work on the whole data set too:
In[12]:= MovingAverage[data, {1, 2, 1}]

Out[12]= {{2004, 18.145}, {2005, 18.39}}
POSTED BY: David Keith
Posted 10 years ago
Thank you for a very good answer.
Now I found som more data:

Number of people that was accepted to the program.Possible students that are allowed to search based on population.

I've added them to the first post. How do i get these values into the function?

Best Regards GA
POSTED BY: G A
Posted 10 years ago
Use the same method as used for the first category of data, with each of the categories analyzed separately.
POSTED BY: David Keith
Hi David,
Thanks for your excellent information
Moving Average works perfect with a/m model but I am still strugeling when using a large number of data (approx. 3000).
MovingAverage[SdataAll[[All, 2]], {1, 2, 1}] works fine but not with fdata = MovingAverage[SdataAll, {1, 2, 1}]. I don't know why. Do you have suggestions?
For your information, requested file attached.
Your support will be highly appreciated !
Jos
POSTED BY: Jos Klaps
Posted 10 years ago
Hi Jos,
Pease paste your code blocks into a spikey block. (See the community guide for help, if needed.) The text editor does bad things to code because it's looking for its formatting commands.   Also, please make sure you post enough information. The code blocks and attaching the data file would be great. Note that there was no file attched to your last post. 3000 data elements is not a lot -- Mathematica won't even burp.

Best,
David
POSTED BY: David Keith
Hi David,
Thanks for your reply.
I can't upload my .nb file. I don't know why, hopfully the Wolfram help desk can fix the problem.
Keep in touch !
Jos
POSTED BY: Jos Klaps
Reply to this discussion
Community posts can be styled and formatted using the Markdown syntax.
Reply Preview
Attachments
Remove
or Discard

Group Abstract Group Abstract