MODERATOR NOTE: This post contains parts written by kglr, which can be found here.
I am sharing this because it's a commonly occurring issue in financial time series, and other applications.
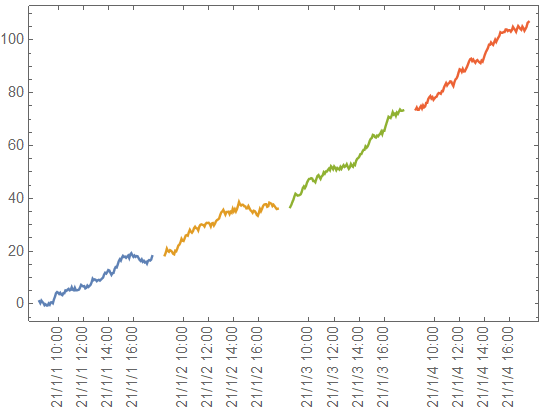
I have a time series sampled at 5-minute frequency for a financial instrument that trades from 08:30 to 15:15 CT. No trading takes place outside those hours.
I want to plot the series with the x-axis showing the series timestamps, but without gaps or interpolation. Neither DateListPlot nor ListLinePlot appears able to accomplish this.
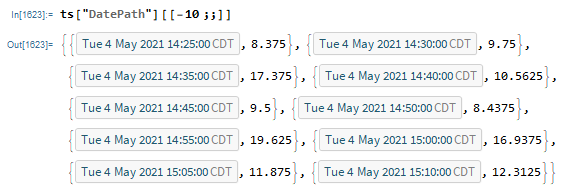
The timeseries looks like this:
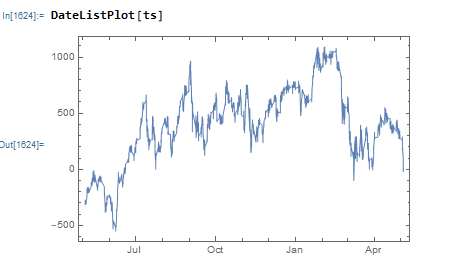
On a large enough timescale a DateListPlot looks fine:
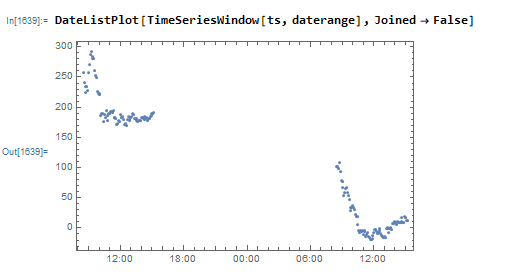
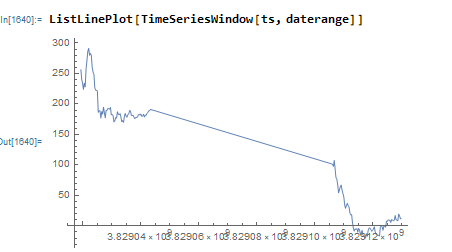
However, on a shorter timescale the plot shows gaps that are either filled with (meaningless) interpolated values:
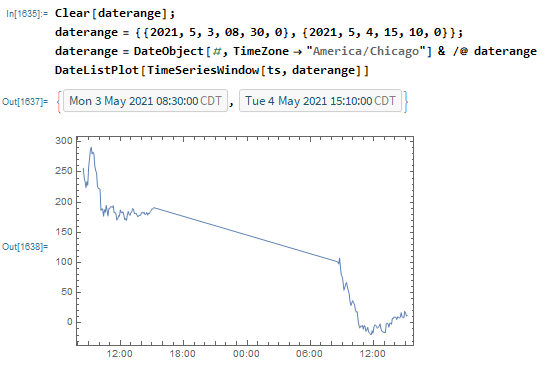
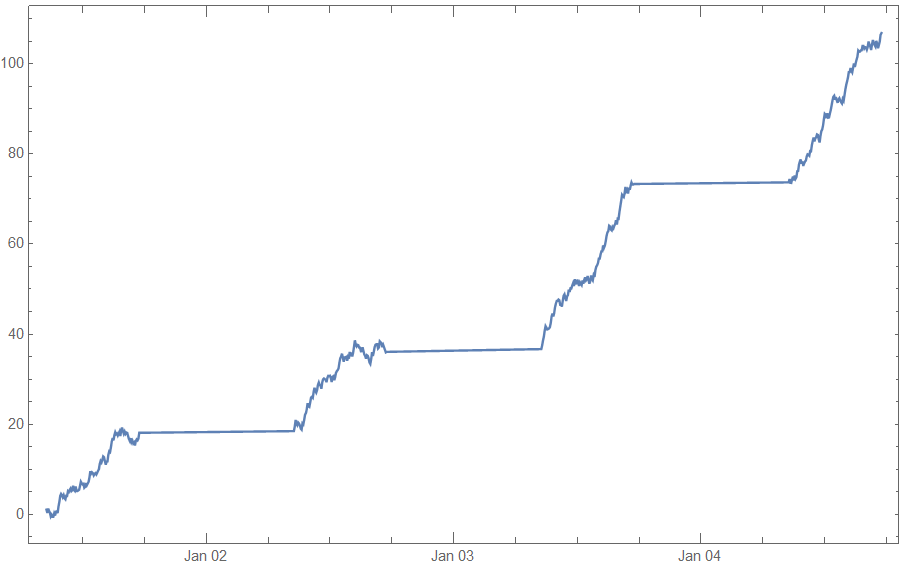
or else are plotted with a large gaps between days:
Nor is ListPLot much help:
What is required, of course, is to be able to restrict the plot range to the hours of 08:30 to 15:15, i.e. to redefine a "day" or use "session hours" rather than the standard 24-hour clock times.
A number of excellent solutions were offered on Stack Exchange that I reproduce in part here, as I believe they could be useful for fellow finance practitioners. I would encourage WR to encapsulate the functionality of at least one of them in a new, native WL function in a future release.
MODERATOR NOTE: The following part was written by kglr, and can be found here.
SOLUTIONS:
First an input dataset with a structure as described above
dates = Join @@ Table[DateRange[DateList[{2021, 1, i, 8, 30}],
     DateList[{2021, 1, i, 17, 30}], Quantity[5, "Minutes"]], {i, 1, 4}];

SeedRandom[1]
data = Transpose[{dates, Accumulate[RandomReal[{-1, 3/2}, Length@dates]]}];

DateListPlot[data, ImageSize -> 600]
Use GroupBy to get a data set for each day:
datasets = Values[GroupBy[data, #[[1, ;; 3]] &]];
1) We can combine the separate DateListPlots for each day using Lukas Lang's ResourceFunction["PlotGrid"].
Use DateListPlot (specifying horizontal FrameTicks explicitly) for each dataset:
ClearAll[dateTicks]
dateTicks = Module[{minmax = MinMax[AbsoluteTime /@ #[[All, 1]]]},
    Select[First @ minmax <= #[[1]] <= Last @ minmax &]@
     System`DateListPlotDump`DateTicks[minmax, 6,
   {"YearShort", "/", "MonthShort", "/", "DayShort", " ", "Hour", ":", "Minute"}]] &;

yrange = MinMax @ data[[All, 2]];

dlps = Map[DateListPlot[#, PlotRange -> {Automatic, yrange},
     PlotRangePadding -> {Automatic, Scaled[.05]},
     FrameTicks -> {{Automatic, Automatic},
       {MapAt[Rotate[#, Pi/2] &, #, {All, 2}] & @ dateTicks @ #,
        MapAt["" &, #, {All, 2}] & @ dateTicks @ #}}] &, datasets];
Combine the plots dlps with Lukas Lang's ResourceFunction["PlotGrid"]:
ResourceFunction["PlotGrid"][{dlps}, "MergeAxes" -> "Cut",
 Spacings -> 10, ImageSize -> 600, AspectRatio -> 1/GoldenRatio]
2) Alternatively, we can use the function rowLayout from this answer:
    ClearAll[rowLayout]
    rowLayout[pad_: 0.02][opts : OptionsPattern[]] :=
      Module[{trFs, gridlines, xticks,
         plts = Show[#, PlotRangePadding -> {Scaled[pad], Scaled[pad]}] & /@ #,
         paddings = pad {-1, 1}.# & /@ (First /@ PlotRange /@ #),
         shifts = {1., -1}.# & /@ Partition[Rest@Flatten[First /@ PlotRange /@ #], 2]},
        trFs = TranslationTransform[{#, 0}] & /@
          Accumulate[2 paddings + Prepend[shifts, 0]];
        gridlines = Most @ MapThread[#[{#2 + #3, 0}] &, {trFs,
             PlotRange[#][[1, 2]] & /@ plts, paddings}][[All, 1]];
        xticks = Join @@ Table[MapAt[trFs[[i]][{#, 0}][[1]] &, (FrameTicks /.
               Options[plts[[i]], FrameTicks])[[2, 1]], {All, 1}], {i,  Length@plts}];
        Graphics[MapThread[GeometricTransformation[#[[1]], #2] &, {plts, trFs}],
         FrameTicks -> {{Automatic, All}, {xticks, MapAt["" &, xticks, {All, 2}]}}, opts,
         GridLines -> {gridlines, None}, Frame -> True,
         AspectRatio -> 1/3/GoldenRatio, ImageSize -> 800]] &;

    rowLayout[][ImageSize -> 600, AspectRatio -> 1/GoldenRatio] @ dlps
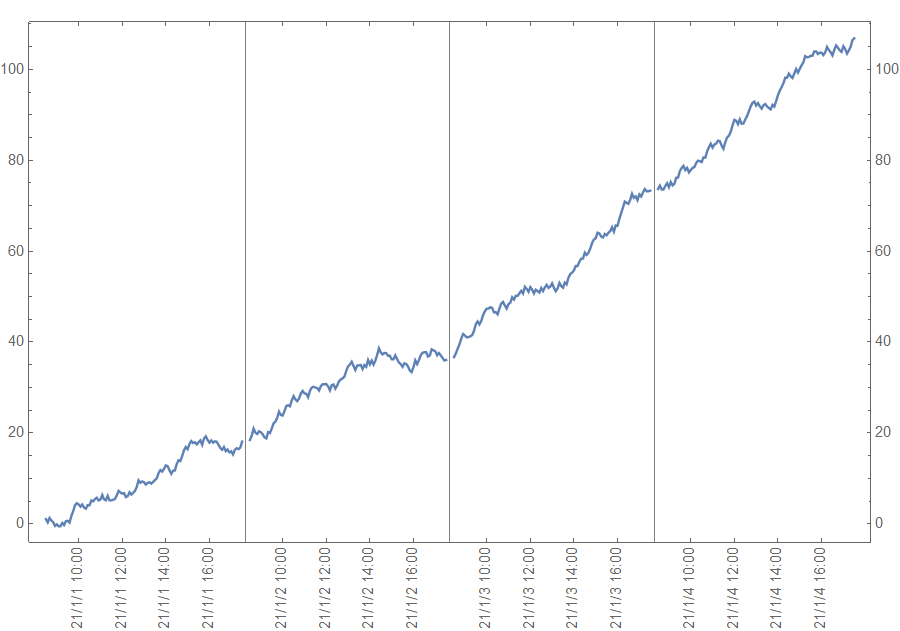
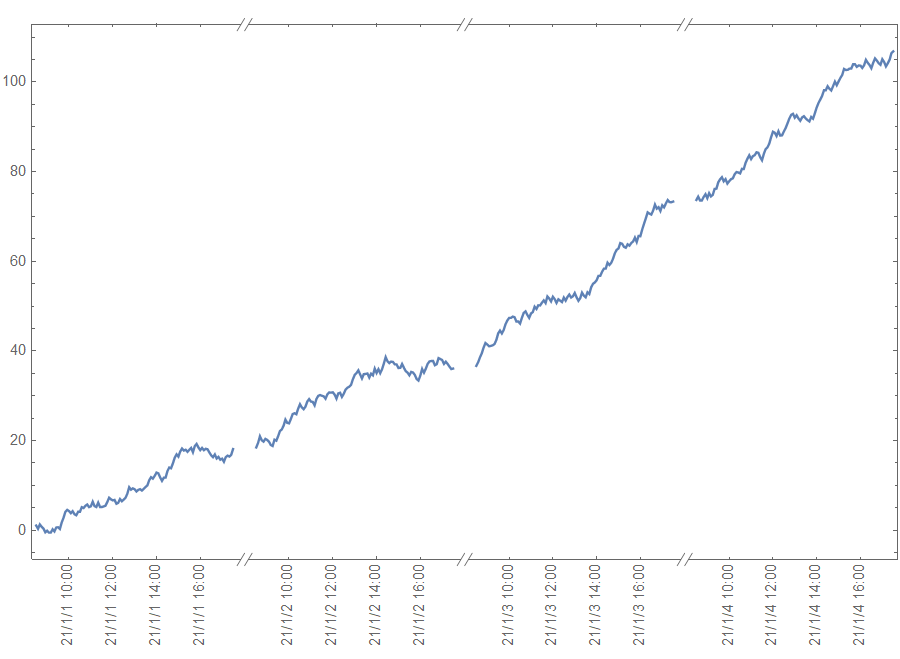
3) We can use TimeSeriesShift to shift the dates for each series in dataset and to construct custom date ticks:
    gap = DateDifference[datasets[[1, -1, 1]], datasets[[2, 1, 1]],
        "Minutes"] - Quantity[60, "Minutes"];

    shiftedseries = Table[TimeSeriesShift[datasets[[i]], -(i - 1) gap], {i, 1, 4}];

    ticks = TimeSeries[dateTicks @ #] & /@ datasets;

    dticks = MapAt[Rotate[#, Pi/2] &, #, {All, 2}] &[
      Join @@ Table[TimeSeriesShift[ticks[[i]], -(i - 1) gap]["Path"], {i, 1, 4}]];

    DateListPlot[shiftedseries, FrameTicks -> {{Automatic, Automatic}, {dticks, Automatic}}]