Message Boards Message Boards

0
|
11147 Views
|
6 Replies
|
2 Total Likes
View groups...
Share
Share this post:

Plotting a family of curves

Posted 10 years ago
Hello, I have the following issue:
I need to plot a 2D function with various values of a parameter. i.e. f(x)=ax+5, on the same plot.
This is easily accomplished. Now i need to put on each curve the respective value of parameter a. Any ideas how can this be achieved?
POSTED BY: Kostas Ladiellis
6 Replies
Posted 10 years ago
I just post this (somewhat ugly) code as just an illustration of customizability (in short time). There are nicer ways and there are issues of overlaps , above/below etc.
  fun[f_, x_, a_List, x0_, x1_, c_, yp_, al_, off_,
 
   opts : OptionsPattern[]] :=
 
  With[{p = c (x0 + x1)},
 
   Plot[Evaluate[f[x, #] & /@ a], {x, x0, x1},
 
    Epilog -> ({Text[Framed[g[x, #]], {p, yp f[p, #]}, {0, off}],

        Arrow[{{p, yp f[p, #]}, { al p, f[al p, #]}}]} & /@ a),

   Evaluate@FilterRules[{opts}, Options[Plot]]]]

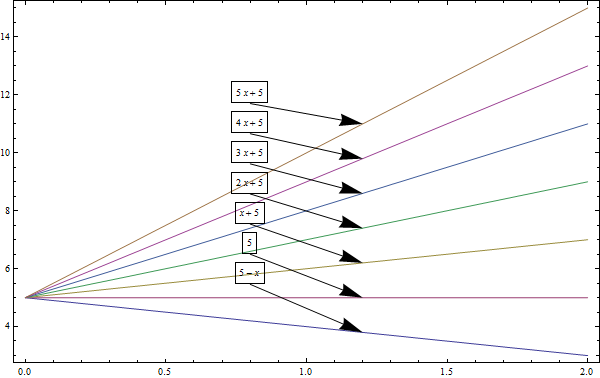
For the example function:
g[x_, a_] := a x + 5


You can play to find desirable parameters:
Manipulate[
fun[g, x, {-1, 0, 1, 2, 3, 4, 5}, 0, 2, s, y, arrow, offset, ImageSize -> 500],
{{s, 0.5}, 0.2, 0.9, Appearance -> "Labeled"}, {{y, 1.3}, 0.4, 2, Appearance -> "Labeled"}, {arrow, 0.5, 2, ppearance -> "Labeled"},
{offset, -1, -0.5,Appearance -> "Labeled"}]

 Obviously, PlotLegends  and wrappers such as Tooltip (as has been posted) are other options. I am merely illustrating customizability and am certain expert users have more robust approaches.
POSTED BY: Mark Dooris
One possibility is to use Tooltips.  The value will not be visible until the mouse is over the curve.  So this may not be what you want (especially if you want to export the plot to another enviornment). 
Plot[Evaluate@Table[Tooltip[a x + 5, a], {a, 1, 5}], {x, 0, 3}]

The challenge for actually putting the value on the curve itself (and there are many ways to do this) is that you may not know ahead of time if the shown values will be (a) sufficiently separated to not be on top of each other and (b) not be ambiguous because curves are close to each other. 

In a case like this I'd generally choose a plot legend as in 
Plot[Evaluate@Table[a x + 5, {a, 1, 5}], {x, 0, 3}, PlotLegends -> Automatic]

But if you want to put the values on the plot, and you know that they will be clear, then you can use Epilog with something like Text.
 Module[{textData},
 
  textData =
   With[{x = 2}, Table[Text[a, {x, a x + 5}, {0, -1}], {a, 1, 5}]];
 
  Plot[Evaluate@Table[Tooltip[a x + 5, a], {a, 1, 5}], {x, 0, 3},
   Prolog -> textData]
 
  ]
POSTED BY: David Reiss
Posted 10 years ago
You can add the labels by hand using the drawing tools. Right-click the graphic and select "Drawing Tools" from the menu. Then use the text tools.
You can then right-click the graphic and use "Save As" to save the annotated graphic to a file.

POSTED BY: David Keith
By hand?  What a concept.  Very retro...  ;-)
But a good idea.
POSTED BY: David Reiss
Posted 10 years ago
Yeah -- Retro is certainly the word for it!  ;-)
POSTED BY: David Keith
Thanks for your suggestions guys. I think this feature is something that should be built in mathematica, as option for plots.
POSTED BY: Kostas Ladiellis
Reply to this discussion
Community posts can be styled and formatted using the Markdown syntax.
Reply Preview
Attachments
Remove
or Discard

Group Abstract Group Abstract