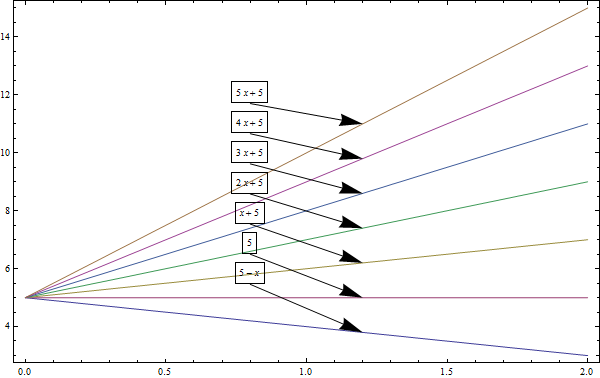
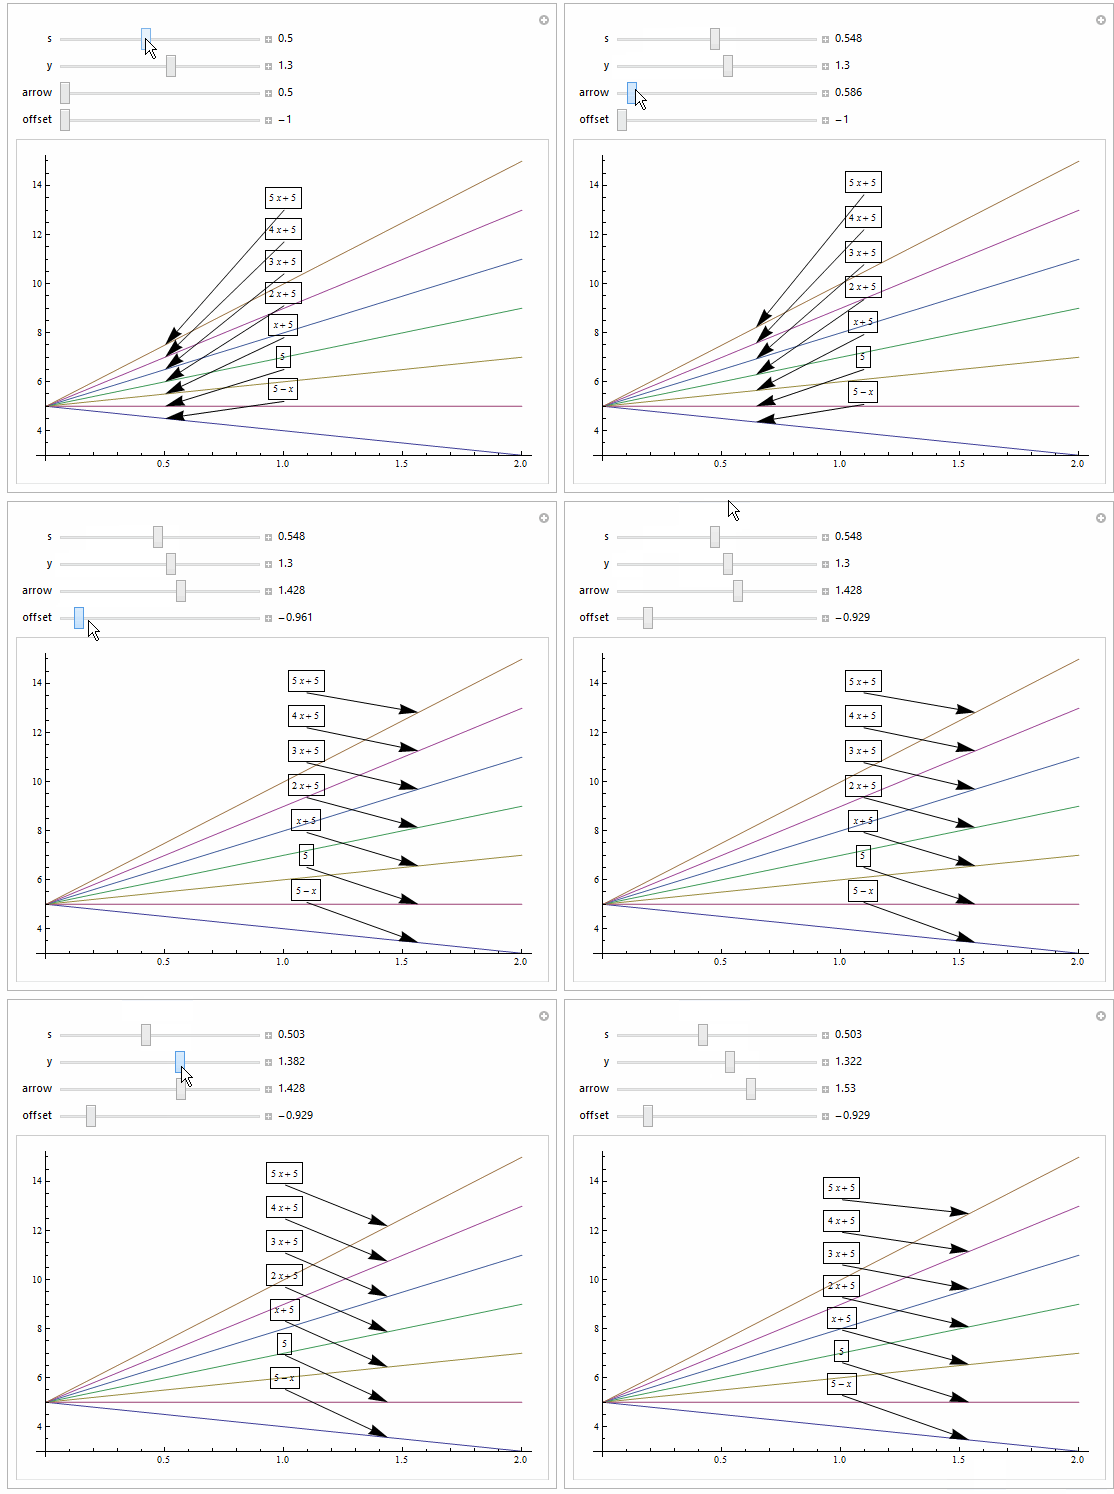
I just post this (somewhat ugly) code as just an illustration of customizability (in short time). There are nicer ways and there are issues of overlaps , above/below etc.
fun[f_, x_, a_List, x0_, x1_, c_, yp_, al_, off_,
opts : OptionsPattern[]] :=
With[{p = c (x0 + x1)},
Plot[Evaluate[f[x, #] & /@ a], {x, x0, x1},
Epilog -> ({Text[Framed[g[x, #]], {p, yp f[p, #]}, {0, off}],
Arrow[{{p, yp f[p, #]}, { al p, f[al p, #]}}]} & /@ a),
Evaluate@FilterRules[{opts}, Options[Plot]]]]
For the example function:
g[x_, a_] := a x + 5

You can play to find desirable parameters:
Manipulate[
fun[g, x, {-1, 0, 1, 2, 3, 4, 5}, 0, 2, s, y, arrow, offset, ImageSize -> 500],
{{s, 0.5}, 0.2, 0.9, Appearance -> "Labeled"}, {{y, 1.3}, 0.4, 2, Appearance -> "Labeled"}, {arrow, 0.5, 2, ppearance -> "Labeled"},
{offset, -1, -0.5,Appearance -> "Labeled"}]

Obviously, PlotLegends and wrappers such as Tooltip (as has been posted) are other options. I am merely illustrating customizability and am certain expert users have more robust approaches.