Hello, I have made the given code:
u[r_, phi_] :=
0.018778093057411193`*
Sum[BesselJ[n, 1.5*r] Exp[I n phi], {n, -5, 5}] +     Sum[(0.00042221117650360055`*BesselJ[n, 3*r] +
3.026131439416714`*^-10*BesselY[n, 3*r])*Exp[I n phi], {n, -5,
5}] + Sum[
5.062485836886407`*^-9*HankelH1[n, r] Exp[I n phi], {n, -5, 5}];
v[x_, y_] =
     TransformedField["Polar" -> "Cartesian",
      u[r, phi], {r, phi} -> {x, y}]
    contourPotentialPlot1 =
      ContourPlot[Re[v[x, y]], {x, -0.3, 0.3}, {y, -0.3, 0.3},
       PlotRange -> Automatic, Contours -> 15, Axes -> True,
       PlotPoints -> 30, PlotRangePadding -> 0, Frame -> False,
       ColorFunction -> "DarkRainbow"];

    potential1 =
      Plot3D[Re[v[x, y]], {x, -0.3, 0.3}, {y, -0.3, 0.3},
       PlotRange -> Automatic, ClippingStyle -> None,
       MeshFunctions -> {#3 &}, Mesh -> 15, MeshStyle -> Opacity[.5],
       MeshShading -> {{Opacity[.3], Blue}, {Opacity[.8], Orange}},
       Lighting -> "Neutral"];

    level = -1.2 10^8; gr =
     Graphics3D[{Texture[contourPotentialPlot1], EdgeForm[],
       Polygon[{{-400, -300, level}, {400, -300, level}, {400, 300,
          level}, {-400, 300, level}},
        VertexTextureCoordinates -> {{0, 0}, {1, 0}, {1, 1}, {0, 1}}]},
      Lighting -> "Neutral"];

    Show[potential1, gr, PlotRange -> All, BoxRatios -> {1, 1, .6},
     FaceGrids -> {Back, Left}]
resulting in this:
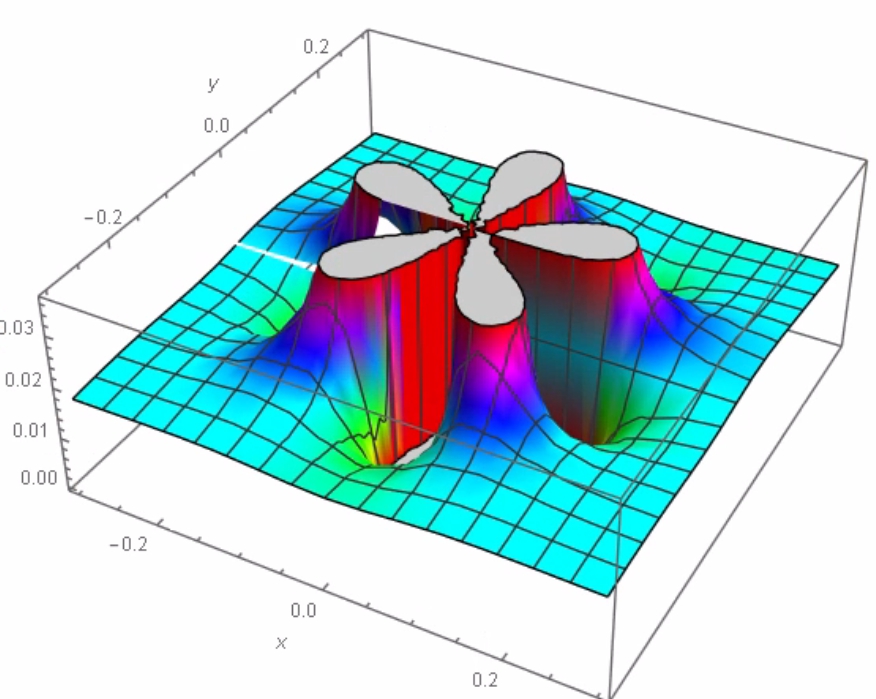
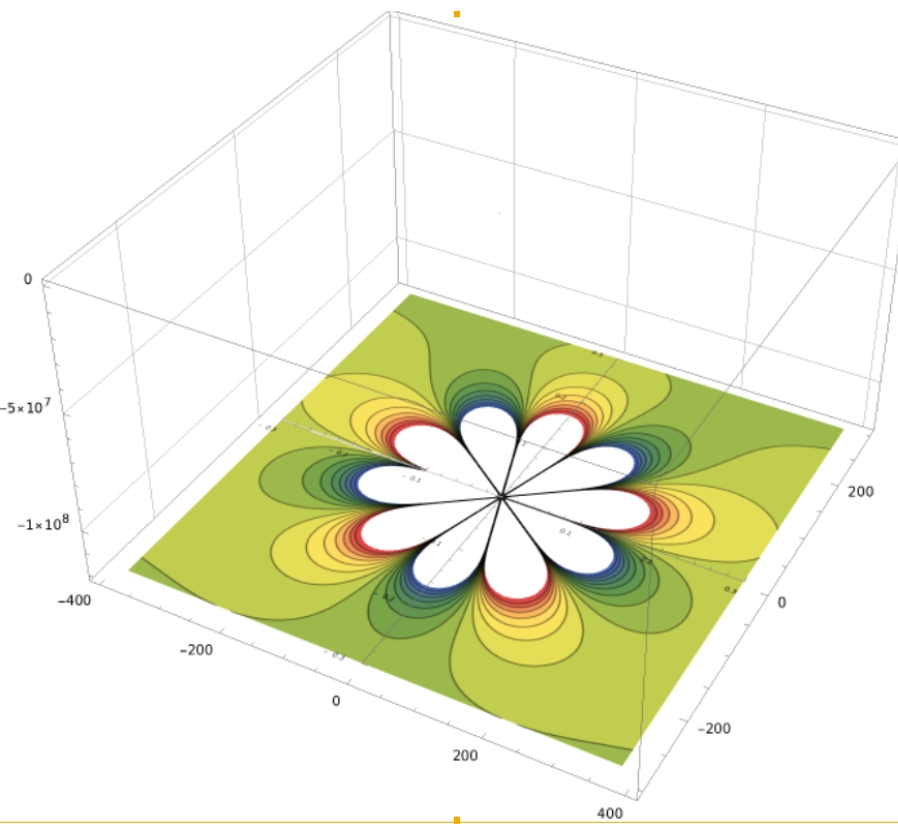 However, it does not show the 3D element over the contourplot. The 3D element should look like the figure below, however it is missing in the plot. How can I show it?
Thanks