Message Boards Message Boards

1
|
3724 Views
|
5 Replies
|
4 Total Likes
View groups...
Share
Share this post:

Missing 3D graphic inside plot?

Posted 3 years ago

Hello, I have made the given code:

u[r_, phi_] := 
0.018778093057411193`*
Sum[BesselJ[n, 1.5*r] Exp[I n phi], {n, -5, 5}] +     Sum[(0.00042221117650360055`*BesselJ[n, 3*r] + 
3.026131439416714`*^-10*BesselY[n, 3*r])*Exp[I n phi], {n, -5, 
5}] + Sum[
5.062485836886407`*^-9*HankelH1[n, r] Exp[I n phi], {n, -5, 5}];
v[x_, y_] = 
     TransformedField["Polar" -> "Cartesian", 
      u[r, phi], {r, phi} -> {x, y}]
    contourPotentialPlot1 = 
      ContourPlot[Re[v[x, y]], {x, -0.3, 0.3}, {y, -0.3, 0.3}, 
       PlotRange -> Automatic, Contours -> 15, Axes -> True, 
       PlotPoints -> 30, PlotRangePadding -> 0, Frame -> False, 
       ColorFunction -> "DarkRainbow"];

    potential1 = 
      Plot3D[Re[v[x, y]], {x, -0.3, 0.3}, {y, -0.3, 0.3}, 
       PlotRange -> Automatic, ClippingStyle -> None, 
       MeshFunctions -> {#3 &}, Mesh -> 15, MeshStyle -> Opacity[.5], 
       MeshShading -> {{Opacity[.3], Blue}, {Opacity[.8], Orange}}, 
       Lighting -> "Neutral"];

    level = -1.2 10^8; gr = 
     Graphics3D[{Texture[contourPotentialPlot1], EdgeForm[], 
       Polygon[{{-400, -300, level}, {400, -300, level}, {400, 300, 
          level}, {-400, 300, level}}, 
        VertexTextureCoordinates -> {{0, 0}, {1, 0}, {1, 1}, {0, 1}}]}, 
      Lighting -> "Neutral"];

    Show[potential1, gr, PlotRange -> All, BoxRatios -> {1, 1, .6}, 
     FaceGrids -> {Back, Left}]

resulting in this:
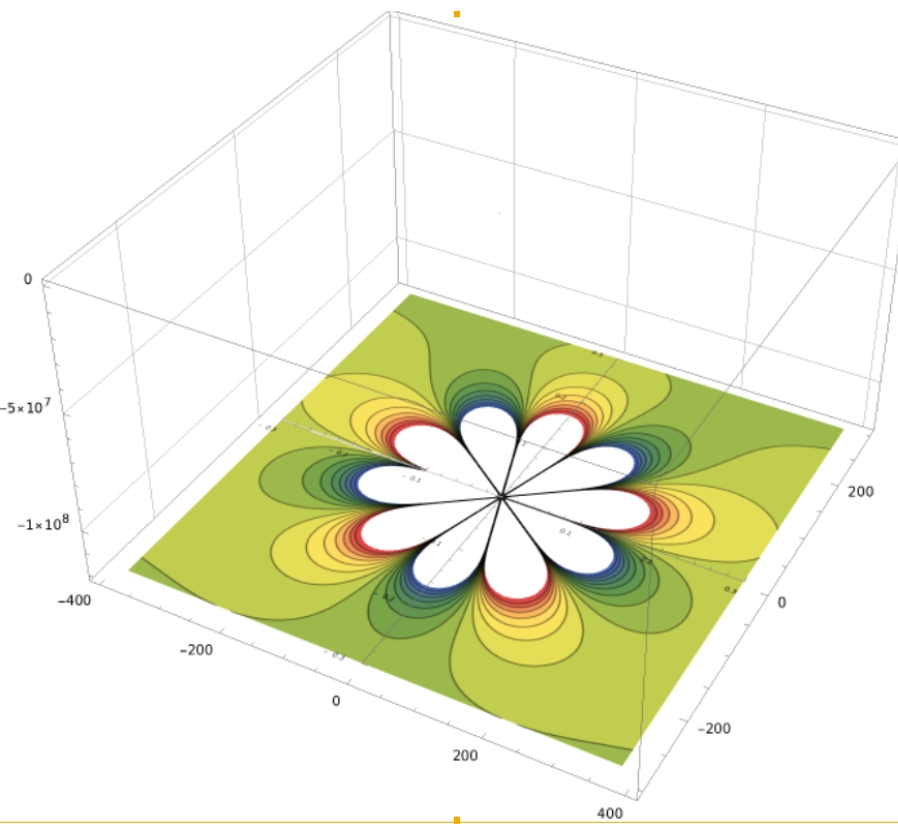
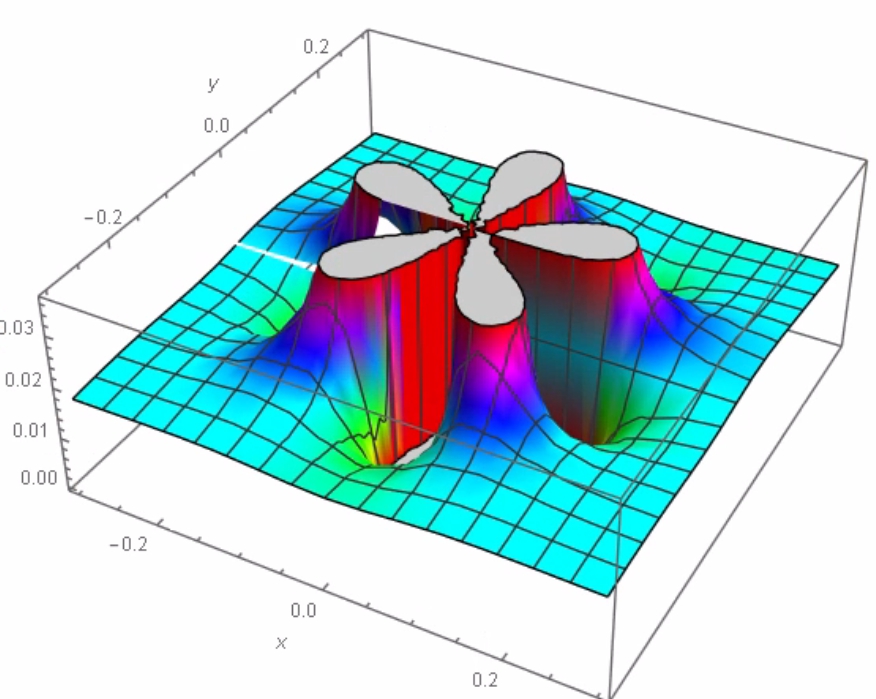
enter image description here However, it does not show the 3D element over the contourplot. The 3D element should look like the figure below, however it is missing in the plot. How can I show it?

Thanks
enter image description here

POSTED BY: Ser Man
5 Replies
Posted 3 years ago

Hello thanks for this. It looks good now, the Real component.

enter image description here

However the Imaginary component "moves" the base-contour up. Have a look, what can I do to make this similar to the Real component?

enter image description here

when using this:

    contourPotentialPlot1 = 
      ContourPlot[Im[v[x, y]], {x, -0.3, 0.3}, {y, -0.3, 0.3}, 
       PlotRange -> Automatic, Contours -> 15, Axes -> True, 
       PlotPoints -> 30, PlotRangePadding -> 0, Frame -> False, 
       ColorFunction -> "DarkRainbow",
     ClippingStyle -> Automatic];
potential1 = 
  Plot3D[Im[v[x, y]], {x, -0.3, 0.3}, {y, -0.3, 0.3}, 
   PlotRange -> Automatic, ClippingStyle -> None, 
   MeshFunctions -> {#3 &}, Mesh -> 15, MeshStyle -> Opacity[.5], 
   MeshShading -> {{Opacity[.3], Blue}, {Opacity[.8], Orange}}, 
   Lighting -> "Neutral" ];
evel = -1.2 10^8; gr = Graphics3D[{Texture[contourPotentialPlot1], 
   Polygon[{{-.3, -.3, -.0}, {.3, -.3, .0}, {.3, .3, .0}, {-.3, .3, .0}}, 
   VertexTextureCoordinates -> {{0, 0}, {1, 0}, {1, 1}, {0, 1}}]},
   Lighting -> "Neutral"];

Show[ gr , potential1,
 PlotRange -> Automatic,
 BoxRatios -> {1, 1, .6},
 FaceGrids -> {Back, Left}]
POSTED BY: Ser Man
Posted 3 years ago

There is no error, Plot3D shows clipped areas in grey, ContourPlot shows them in white. You can change PlotRange to reduce the clipping e.g. PlotRange -> {-5, 5} but because of the pole there will always be some clipping, PlotRange -> All, is not useful in this case. You can use ClippingStyle to specify specific colors for the clipped areas, Automatic will use the extremes of the ColorFunction

ContourPlot[Re[v[x, y]], {x, -0.3, 0.3}, {y, -0.3, 0.3},
 PlotRange -> Automatic,
 Contours -> 15,
 Axes -> True,
 PlotPoints -> 30,
 PlotRangePadding -> 0,
 Frame -> False,
 ColorFunction -> "DarkRainbow",
 ClippingStyle -> Automatic,
 Exclusions -> None]

enter image description here

or specify any color you want e.g.

ClippingStyle -> {RGBColor["#486276"], RGBColor["#AC4640"]}

enter image description here

POSTED BY: Rohit Namjoshi
Posted 3 years ago

Nice, but do you see the error in the contourplot in the base? It is white inside the flower petals. This is a Mathematica error or something else. Do you have any idea what is wrong here?

POSTED BY: Ser Man
Posted 3 years ago

If all you are trying to do is replicate the second image in your question, then

Plot3D[Re[v[x, y]], {x, -0.3, 0.3}, {y, -0.3, 0.3},
 PlotRange -> {{-0.3, 0.3}, {-0.3, 0.3}, {0, .035}},
 ColorFunction -> Hue]

enter image description here

POSTED BY: Rohit Namjoshi
Posted 3 years ago

contourPotentialPlot1 looks fine, however gr, is empty. One problem is the x, y, z range of the graphics objects combined in Show. Partial fix

gr = Graphics3D[{Texture[contourPotentialPlot1], 
   Polygon[{{-.3, -.3, -.0}, {.3, -.3, .0}, {.3, .3, .0}, {-.3, .3, .0}}, 
   VertexTextureCoordinates -> {{0, 0}, {1, 0}, {1, 1}, {0, 1}}]},
   Lighting -> "Neutral"];

Show[gr, potential1,
 PlotRange -> All,
 BoxRatios -> {1, 1, .6},
 FaceGrids -> {Back, Left}]

enter image description here

Cool image!

POSTED BY: Rohit Namjoshi
Reply to this discussion
Community posts can be styled and formatted using the Markdown syntax.
Reply Preview
Attachments
Remove
or Discard

Group Abstract Group Abstract