Introduction
Brain haemorrhage is a type of stroke. It's caused by an artery in the brain bursting and causing confined bleeding in the enclosing tissues. This bleeding kills brain cells.
The Greek root for blood is hemo. Haemorrhage means "blood bursting forth." Brain haemorrhages are also called cerebral haemorrhages, intracranial haemorrhages, or intracerebral haemorrhages.
Cerebral haemorrhage deems for about 13% of all strokes in the United States. It is the next foremost cause of stroke. (The principal cause of stroke is a blood clot – thrombus – in an artery in the brain, which blocks blood flow and cuts off required oxygen and nutrients to the brain.)
Importing Dataset
I implied a data set of haemorrhage and non-haemorrhage brain from Kaggle. Each class placed in its corresponding variable.
infected=FileNames["*.png","E:\\COURSES\\Wolfram\\BrainTumorImagesDataset\\training_set\\hemmorhage_data"];
uninfected=FileNames["*.png","E:\\COURSES\\Wolfram\\BrainTumorImagesDataset\\training_set\\non_hemmorhage_data"];
Constructing File Objects for Images
I wanted to match each brain image with a value of either true for Hemorrhage or false for no Hemorrhage. To improve the efficiency of the importation, I formulated separate file objects for each of the image variables. Each variable contained 70 images for parasitized and uninfected cells.
infectedIMG = File /@ infected;
uninfectedIMG = File /@ uninfected;
Then I created a record of 70 true and false values which would be used to be matched up with their respective images. I set these lists in variables and made another variable to connect the list of true and false values along with another variable that connected the infected and uninfected file objects.
Length[infectedIMG]
70
infectedvalues=Table[True,Length[infected]];Length[uninfected]
70
uninfectedvalues=Table[False,Length[uninfected]];
Finally, using the AssociationThread function, I associated the images with their values and divided the data into two groups, 75% for training and 25% for validation.
data=RandomSample[AssociationThread[infectedIMG->infectedvalues]];
traininglength=Length[data]*.75
52.5
trainingdata=data[[1;;52]];validationdata=data[[53;;]];
Creating the Neural Network
I then started to work on the Neural Network, which used MNIST image classification. The network's goal is to classify uninfected and infected using true and false to describe whether the patient suffers Brain Haemorrhage or not. I built a NetChain function that had multiple layers. One striking layer is the Resize layer which changes the image dimensions of each image to 135 by 135. This changes the images to comply with the sensitivity of the neural network to the size of images. Further layers include the convolution layer, ramp, and pooling layer, which all work to narrow down pieces and create categories to classify each image to associate them.
dims={135,135}
{135,135}
lenet=NetChain[{ResizeLayer[dims],ConvolutionLayer[20,5],Ramp,(*Takesoutthethenotusefulfeatures*)PoolingLayer[2,2],(*Downsamples*)ConvolutionLayer[50,5],Ramp,(*Takesoutthethenotusefulfeatures*)PoolingLayer[2,2],(*Downsamples*)FlattenLayer[],500,(*Makesfeaturesintofeaturevector"*)Ramp,2,(*Takesoutthethenotusefulfeatures-Trueorfalse*)SoftmaxLayer[]},(*Turnsthevectorintoprobabilities*)"Output"NetDecoder[{"Class",{True,False}}],(*Tensorintotrueorfalse*)"Input"NetEncoder["Image"](*Turnsimageintonumbers*)]
Training the Neural Networks with NetTrain
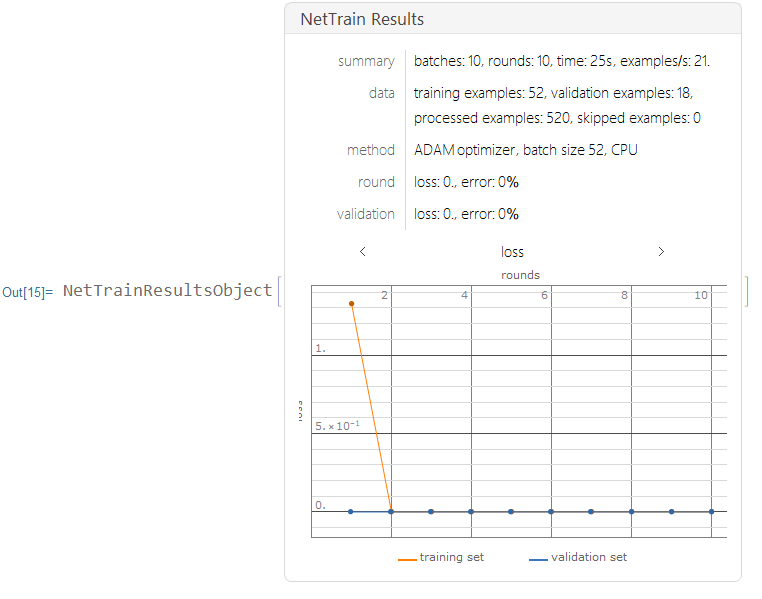
I trained the neural nets with 10 training rounds.
results=NetTrain[lenet,Normal[trainingdata],All,ValidationSet->Normal[validationdata],MaxTrainingRounds->10,TargetDevice->"CPU"]
Training the Neural Network with Augmented Layers
Next I implemented an ImageAugmentationLayer, which randomly crops images to create new data sets to improve my neural network.
augment = ImageAugmentationLayer[{135, 135}, "Input" -> NetEncoder[{"Image", {139, 139}}], "Output" -> NetDecoder["Image"]]
I made the images 139 by 139 and allowed the augmentation layer to crop the images by 4 pixels at random within the constraints of the dimensions of 135 by 135.
dims2 = {139, 139}
lenet2 = NetChain[{ResizeLayer[dims2],
   ImageAugmentationLayer[{135, 135}], ConvolutionLayer[20, 5], Ramp,
   PoolingLayer[2, 2], ConvolutionLayer[50, 5], Ramp,
   PoolingLayer[2, 2], FlattenLayer[], 500, Ramp, 2, SoftmaxLayer[]},
  "Output" -> NetDecoder[{"Class", {True, False}}],
  "Input" -> NetEncoder["Image"]]
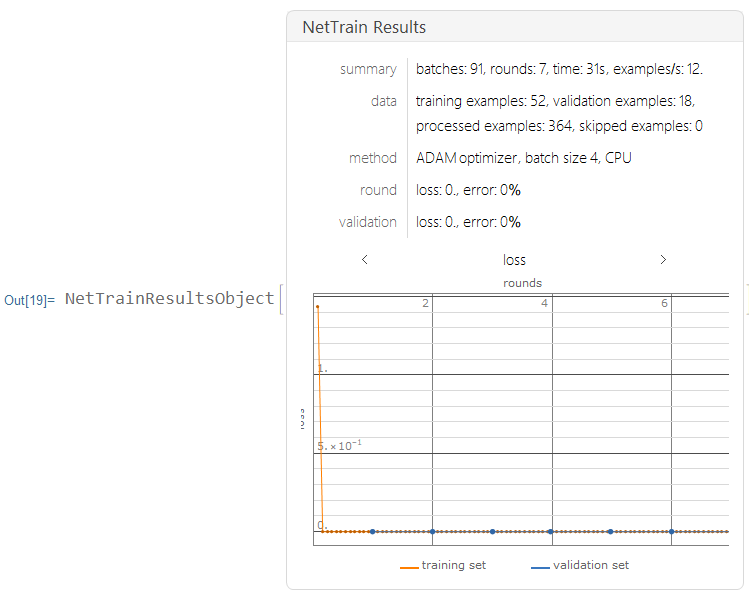
I trained this data using the neural net, with only 7 layers on CPU.
results2 =
  NetTrain[lenet2, Normal[trainingdata], All,
    ValidationSet -> Normal[validationdata], MaxTrainingRounds -> 7]
Creating a Testing Set for Data
Data Visualization
Lastly, I made a ConfusionMatrixPlot using the Classifier Measurements function which compares the neural networks predicted class against the actual class result. 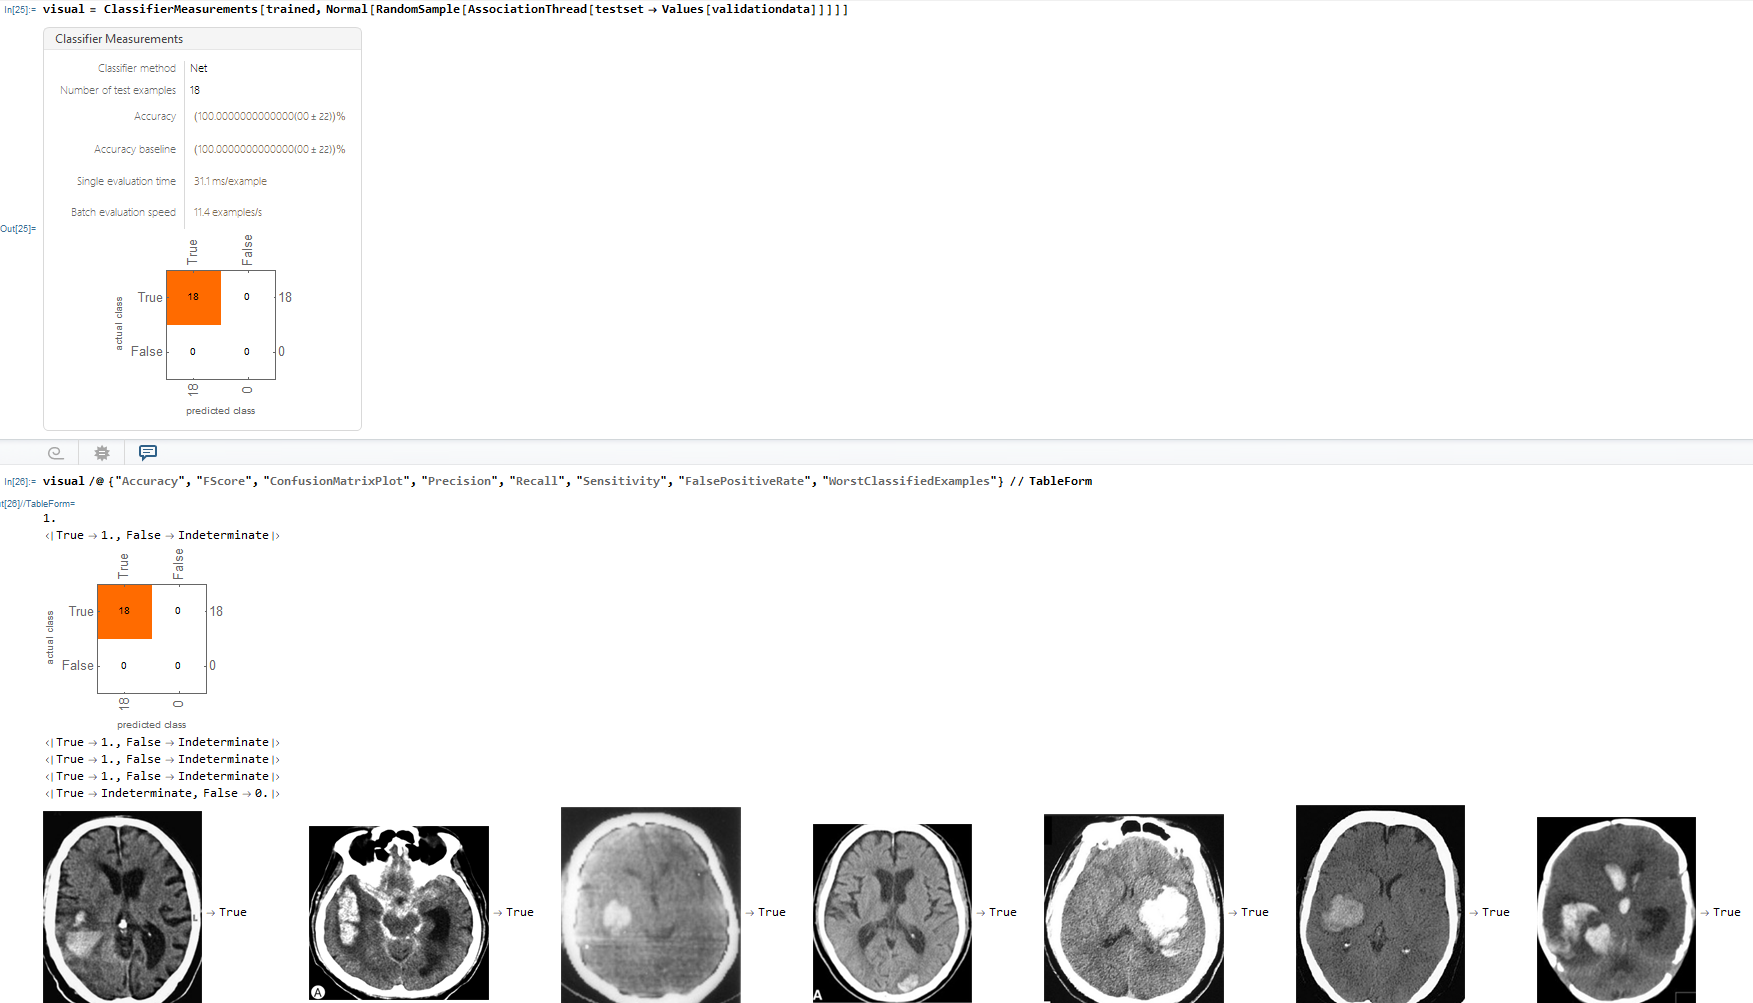
Conclusion
I built a neural network that strongly diagnosed Brain Haemorrhage with an accuracy of about 99.000000078%. Furthermore, as displayed in the ConfusionMatrix, there were 18 examples of the neural network prediction matching with the actual results for true and 18 examples of the neural network and actual matching for true.
Future Improvements
To additionally enhance this project, I could implement more augmented datasets to further train and enhance the neural net. Moreover, I could use various images from different datasets to prevent overfitting and improve efficiency. Lastly, I could execute a function that pinpoints Brain Haemorrhage by finding the edges of the Haemorrhage area and sensing the infected cells through the function, image distribution and colour detection.
 Attachments:


