I wrote a function which counts the neighborhood size of each node in a graph, as the neighborhood size increases. It then weights closer neighbors more than father neighbors, but does take the global neighborhood into account. It then colors the graph according to this weighted global neighborhood, visualizing perhaps a rough estimate of local dimension sizes of the graph. The notebook is attached to this post. Here are some graphs colored according to the function: 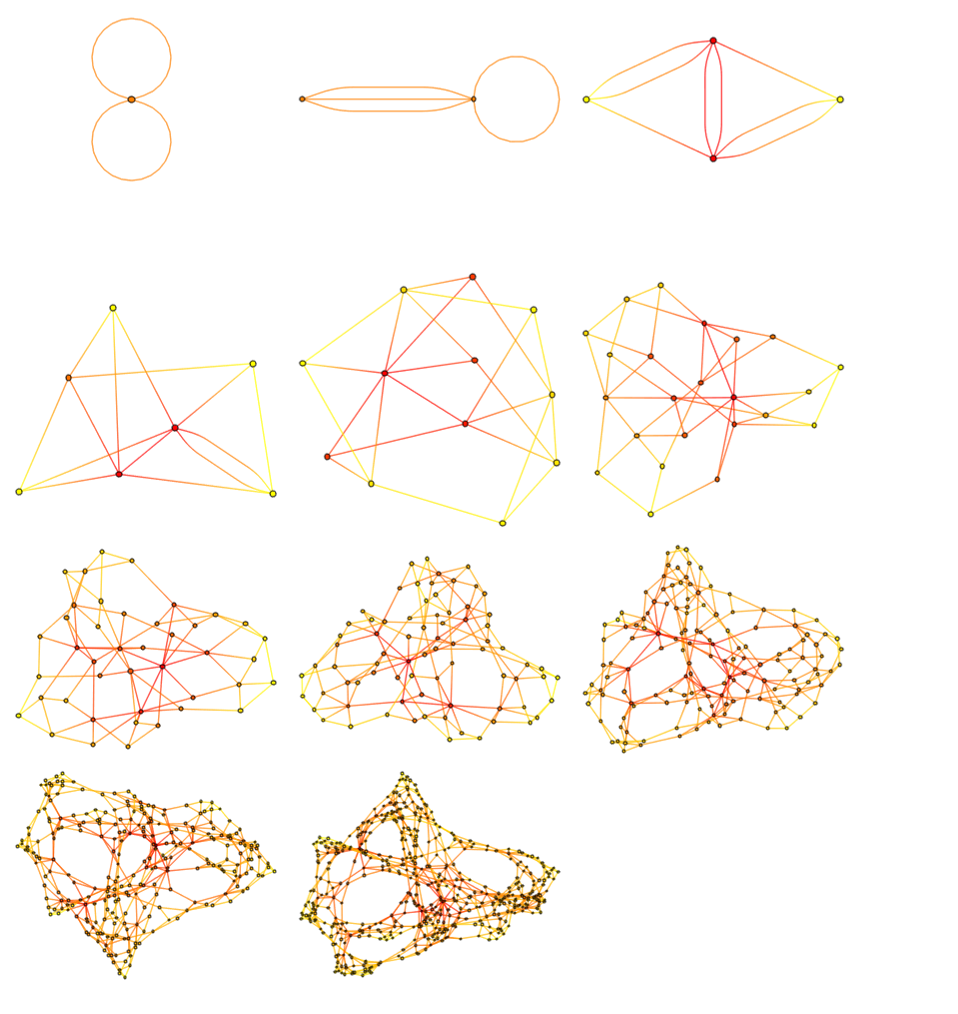
 Attachments:



