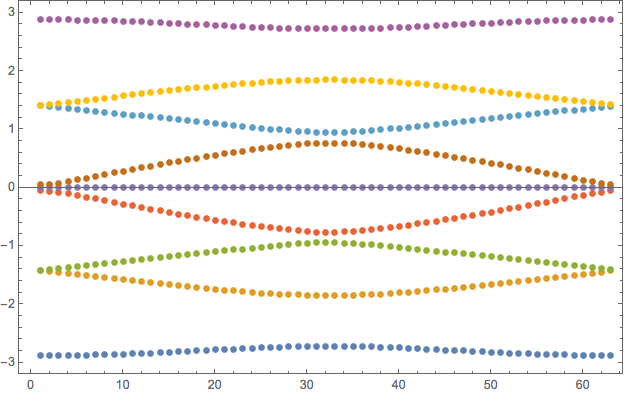
This is because you entered the matrix in symbolic form and span only integers. In this case Mathematica will try to give you a symbolic answer in terms of radicals, fractions, etc. But you need plot - so you do not care and can do it numerically. Adding for example simple decimal point - say in step size - 1.0 will do.
Clear[T, a]
T[a_] := {
{0, 1 + 1/(5 Sqrt[2]), 1, 1, 1, 0, 0, 0, 0},
{1 + 1/(5 Sqrt[2]), 0, 0, 0, 0, 1, 0, 0, 1},
{1, 0, 0, 0, 0, E^(I a), 1, 0, 0},
{1, 0, 0, 0, 0, 0, 1, 1, 0},
{1, 0, 0, 0, 0, 0, 0, 1, 1},
{0, 1, E^(-I a), 0, 0, 0, 0, 0, 0},
{0, 0, 1, 1, 0, 0, 0, 0, 0},
{0, 0, 0, 1, 1, 0, 0, 0, 0},
{0, 1, 0, 0, 1, 0, 0, 0, 0}
}
G[a_] := Eigenvalues[T[a]];
data = Table[Eigenvalues[T[a/10]], {a, 0, 62, 1.}];
ListPlot[Transpose[Sort/@data], Frame -> True]
