Message Boards Message Boards

0
|
7990 Views
|
5 Replies
|
5 Total Likes
View groups...
Share
Share this post:

plotting eigenvalues of a matrix, speed issues

Posted 10 years ago
I have an explicit 10 by 10 Matrix that depends on one variable and I would like to plot the eigenvalues of the matrix as a function of this variable. Using a direct plot results in a rather garbled graph because mathematica tries to draw the eigenvalues as continuous lines. So I would like some discrete plot where it just draws a little dot for each eigenvalue without trying to connect anything. I found the command 'DiscretePlot' with the option 'Filling None' or using 'Table' to generate a list and try to plot this afterwards. This seems to generate strange speed issues. Evaluating the function at one value is instanteneous, plotting it takes less than 5 seconds on my laptop. Filling a table a or a discrete plot for 50 values of the variable takes about 10 minutes. Experimenting with shorter tables it seems the time Mathematica takes to fill the table is not linear in the length but is growing much faster.
Any explanation of what could be going on or simpler solutions to my initial problem would be appreciated. Thanks.
POSTED BY: ralf rueckriemen
5 Replies
Folks here would have much easer time debugging your code if you would actually post it. Here are some tips on posting code - you can also attach a notebook:

How to type up a post: editor tutorial & general tips
POSTED BY: Sam Carrettie
 Clear[T, a]
 T[a_] := {{0, 1 + Sqrt[2]/10, 1, 1, 1, 0, 0, 0, 0}, {1 + Sqrt[2]/10,
    0, 0, 0, 0, 1, 0, 0, 1}, {1, 0, 0, 0, 0, Exp[I*a], 1, 0, 0}, {1, 0,
     0, 0, 0, 0, 1, 1, 0}, {1, 0, 0, 0, 0, 0, 0, 1, 1}, {0, 1,
    Exp[-I*a], 0, 0, 0, 0, 0, 0}, {0, 0, 1, 1, 0, 0, 0, 0, 0}, {0, 0,
    0, 1, 1, 0, 0, 0, 0}, {0, 1, 0, 0, 1, 0, 0, 0, 0}}
 G[a_] := Eigenvalues[T[a]]
 Plot[G[a], {a, 0, 2 Pi}]
 DiscretePlot[Eigenvalues[T[a/10]], {a, 0, 62}, Filling -> None]
This is an example of what I am trying to do. The Plot command takes less than 5 seconds to execute but is not very useful. The discrete plot takes more than 5 min.
POSTED BY: ralf rueckriemen
This is because you entered the matrix in symbolic form and span only integers. In this case Mathematica will try to give you a symbolic answer in terms of radicals, fractions, etc. But you need plot - so you do not care and can do it numerically. Adding for example simple decimal point - say in step size - 1.0 will do.

 Clear[T, a]
 
 T[a_] := {
  {0, 1 + 1/(5 Sqrt[2]), 1, 1, 1, 0, 0, 0, 0},
  {1 + 1/(5 Sqrt[2]), 0, 0, 0, 0, 1, 0, 0, 1},
  {1, 0, 0, 0, 0, E^(I a), 1, 0, 0},
  {1, 0, 0, 0, 0, 0, 1, 1, 0},
  {1, 0, 0, 0, 0, 0, 0, 1, 1},
  {0, 1, E^(-I a), 0, 0, 0, 0, 0, 0},
{0, 0, 1, 1, 0, 0, 0, 0, 0},
{0, 0, 0, 1, 1, 0, 0, 0, 0},
{0, 1, 0, 0, 1, 0, 0, 0, 0}
}

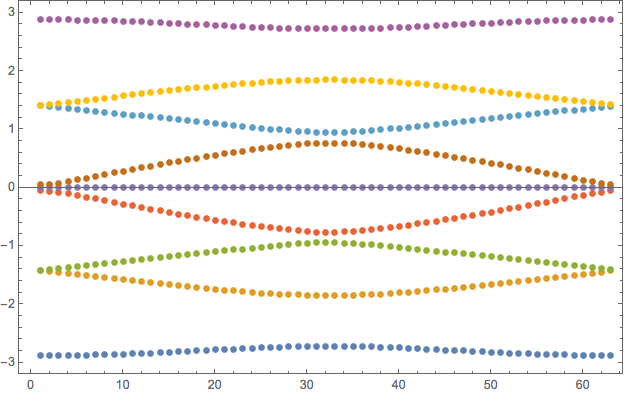
G[a_] := Eigenvalues[T[a]];

data = Table[Eigenvalues[T[a/10]], {a, 0, 62, 1.}];

ListPlot[Transpose[Sort/@data], Frame -> True]

POSTED BY: Sam Carrettie
That works, thanks. So essentially, when I enter 1. instead of 1 it will treat this as an approximation and do further computations with it numerically instead of algebraically? That is a good trick to know in general.
POSTED BY: ralf rueckriemen
Yes. Also note I edited post a bit - to do correct sorting of values.
POSTED BY: Sam Carrettie
Reply to this discussion
Community posts can be styled and formatted using the Markdown syntax.
Reply Preview
Attachments
Remove
or Discard

Group Abstract Group Abstract