Hello, everyone. First, let me apologize for my poor English.
I am trying to calculate the mean power frequency of EMG data by continuous wavelet transform in Mathematica. However, as you know, the data after the continuous wavelet transform shows the frequency component as a ”octaves”.
The code I wrote is as follows:
cwt=ContinuousWaveletTransform[EMGsig], MorletWavelet[]]

ListPlot3D[Abs@Reverse[Last /@ cwt[All]], PlotRange -> All, Mesh -> None, ColorFunction -> "SolarColors", Ticks -> {Automatic, Automatic, Automatic}, AxesLabel -> {"time", "octaves", "magnitude"}, Boxed -> False,  PlotLabel -> Style["EMGsig", 20]]
Then I get the result as shown in the image. 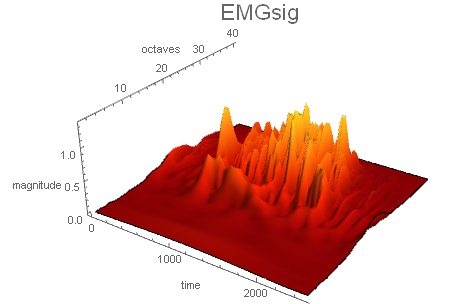
I want to display the frequency(Hz) instead of the ”octaves” when I display the scalogram or 3Dplot, but I don't know how to convert it.
Please tell me how to convert octaves to frequency.


