It's definitely the way the region mesh is generated using the region function.
All the options of the resulting plots are similar with the exception of the PlotRange and PlotRangePadding.
plotl = RegionPlot[regi, Frame -> True, AspectRatio -> Automatic,
   PlotRange -> Full, Mesh -> All];
plotm = RegionPlot[regi, Frame -> True, AspectRatio -> Automatic,
   PlotRange -> {{-lx/50, lx + lx/50}, {-ly/50, ly + ly/50}},
   Mesh -> All];
plotr = RegionPlot[rege, Frame -> True, AspectRatio -> Automatic,
   PlotRange -> Full, Mesh -> All];

Select[Permutations[{lx, ly, 0, 0}, {2}],
   RegionMember[regi, #] &] & /@ {regi, rege}

ops = InputForm[#][[1, 2]] & /@ {plotl, plotm, plotr};
com = Intersection @@ ops
Complement[#, com] & /@ ops

{plotl, plotm, plotr}
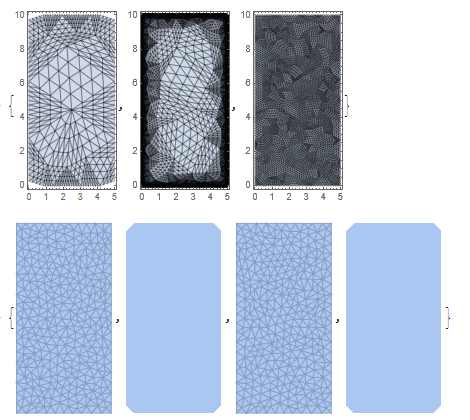
It seems the way the region is generated makes the difference.
{DiscretizeRegion[regi], Region[regi], DiscretizeRegion[rege],
     Region[rege]}
This looks like that in RegionPlot, ImplicitRegion uses Region to start it's Mesh and ParametricRegion uses DiscretizeRegion to start its Mesh.
Table[RegionPlot[regi, AspectRatio -> Automatic, Mesh -> All,
  MaxRecursion -> i], {i, 0, 3}]
Table[RegionPlot[rege, AspectRatio -> Automatic, Mesh -> All,
  MaxRecursion -> i], {i, 0, 3}]
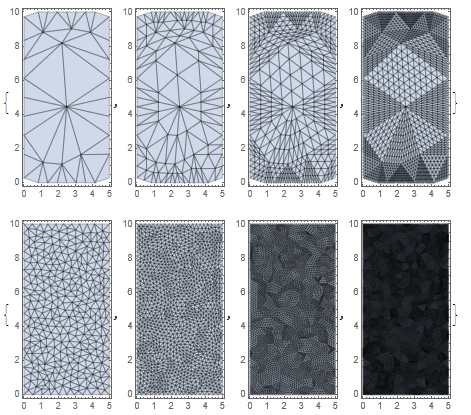
I just don't get why increasing the PlotRange to go just outside the region function changes everything.


