Here is an example solution:
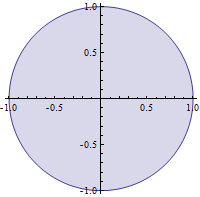
data = Table[{Cos[t], Sin[t]}, {t, Range[0, 2 Pi, 0.01]}];
ListLinePlot[data, AspectRatio -> 1, Filling -> 0]

If the data points are unordered they need to be put in order:
(* starting with ten unordered points *)
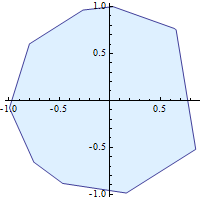
data = Table[{Cos[t], Sin[t]}, {t, RandomReal[{0, 2 Pi}, 10]}];
Needs["ComputationalGeometry`"];
(* arrange points in order *)
anticlockwise = data[[Sequence@ConvexHull[data]]];
sorted = Append[#, First[#]] &@anticlockwise;
ListLinePlot[sorted, Filling -> sorted[[1, 2]],
AspectRatio -> 1, FillingStyle -> LightBlue]

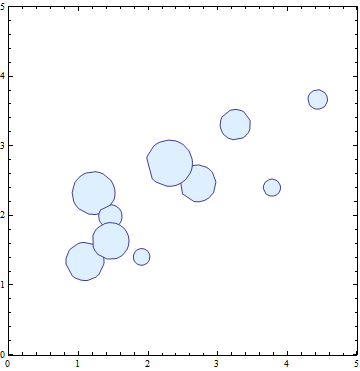
Demonstration with multiple data sets:
(* creating 10 data sets, each with 30 unordered points *)
Array[(c[#] = ({dx1, dy1, sz1} = RandomReal[{1, 4.5}, 3];
data = Table[0.1 sz1 {Cos[t], Sin[t]} + {dx1, dy1},
{t, RandomReal[{0, 2 Pi}, 30]}])) &, 10];
Needs["ComputationalGeometry`"];
Array[(s[#] = (data = c[#];
anticlockwise = data[[Sequence@ConvexHull[data]]];
sorted = Append[#, First[#]] &@anticlockwise)) &, 10];
Show[Array[ListLinePlot[s[#], Filling -> s[#][[1, 2]],
AspectRatio -> 1, FillingStyle -> LightBlue] &, 10],
PlotRange -> {{0, 5}, {0, 5}}, AxesOrigin -> 0, Frame -> True]
