Message Boards Message Boards

0
|
4891 Views
|
6 Replies
|
1 Total Likes
View groups...
Share
Share this post:

Inconsistent TimelinePlot Layout when using time intervals

Posted 2 years ago

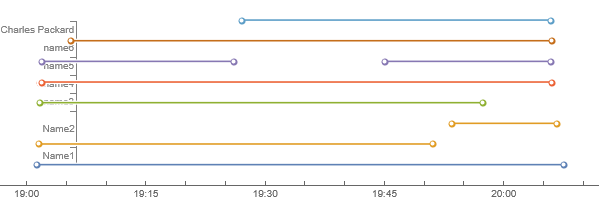
When processing usage logs from an online conferencing platform, I wanted to plot time intervals in H:MM format in TimelinePlot which shows the following issues:

  1. It does not display the intervals consistently i.e. one timeline is grouped whereas the other is stacked in the same plot. The display cannot be changed in PlotLayout.
  2. The vertical axis cuts through the timelines i.e. are not aligned. Manually setting PlotRange.did not help.

As an example, I provide the data to generate the TimelinePlot. When I replace the intervals by e.g. DateObject[{year}] format, all works fine.

Is there an issue with the TimelinePlot or I am missing something? Thanks.

<|"Name1" -> {Interval[{DateObject[{2021, 10, 15, 19, 1, 18.`}, 
       "Instant", "Gregorian", -5.`], 
      DateObject[{2021, 10, 15, 20, 7, 28.`}, "Instant", 
       "Gregorian", -5.`]}]}, 
  "Name2" -> {Interval[{DateObject[{2021, 10, 15, 19, 1, 29.`}, 
       "Instant", "Gregorian", -5.`], 
      DateObject[{2021, 10, 15, 19, 51, 3.`}, "Instant", 
       "Gregorian", -5.`]}], 
    Interval[{DateObject[{2021, 10, 15, 19, 53, 29.`}, "Instant", 
       "Gregorian", -5.`], 
      DateObject[{2021, 10, 15, 20, 6, 36.`}, "Instant", 
       "Gregorian", -5.`]}]}, 
  "name3" -> {Interval[{DateObject[{2021, 10, 15, 19, 1, 30.`}, 
       "Instant", "Gregorian", -5.`], 
      DateObject[{2021, 10, 15, 19, 1, 39.`}, "Instant", 
       "Gregorian", -5.`]}], 
    Interval[{DateObject[{2021, 10, 15, 19, 1, 40.`}, "Instant", 
       "Gregorian", -5.`], 
      DateObject[{2021, 10, 15, 19, 57, 19.`}, "Instant", 
       "Gregorian", -5.`]}]}, 
  "name4" -> {Interval[{DateObject[{2021, 10, 15, 19, 1, 41.`}, 
       "Instant", "Gregorian", -5.`], 
      DateObject[{2021, 10, 15, 19, 1, 55.`}, "Instant", 
       "Gregorian", -5.`]}], 
    Interval[{DateObject[{2021, 10, 15, 19, 1, 56.`}, "Instant", 
       "Gregorian", -5.`], 
      DateObject[{2021, 10, 15, 20, 5, 59.`}, "Instant", 
       "Gregorian", -5.`]}]}, 
  "name5" -> {Interval[{DateObject[{2021, 10, 15, 19, 1, 55.`}, 
       "Instant", "Gregorian", -5.`], 
      DateObject[{2021, 10, 15, 19, 26, 1.`}, "Instant", 
       "Gregorian", -5.`]}], 
    Interval[{DateObject[{2021, 10, 15, 19, 45, 1.`}, "Instant", 
       "Gregorian", -5.`], 
      DateObject[{2021, 10, 15, 20, 5, 55.`}, "Instant", 
       "Gregorian", -5.`]}]}, 
  "name6" -> {Interval[{DateObject[{2021, 10, 15, 19, 5, 22.`}, 
       "Instant", "Gregorian", -5.`], 
      DateObject[{2021, 10, 15, 19, 5, 31.`}, "Instant", 
       "Gregorian", -5.`]}], 
    Interval[{DateObject[{2021, 10, 15, 19, 5, 32.`}, "Instant", 
       "Gregorian", -5.`], 
      DateObject[{2021, 10, 15, 20, 5, 58.`}, "Instant", 
       "Gregorian", -5.`]}]}, 
  "Charles Packard" -> {Interval[{DateObject[{2021, 10, 15, 19, 27, 
        2.`}, "Instant", "Gregorian", -5.`], 
      DateObject[{2021, 10, 15, 20, 5, 54.`}, "Instant", 
       "Gregorian", -5.`]}]}|>;
TimelinePlot[%]
Attachment

Attachments:
POSTED BY: Dave Middleton
6 Replies
Posted 2 years ago

Hi Rohit,

Thanks for the response. The answer is yes, but there is a bit of a story to it.

I already created concurrent user plots over time, which I named Attendance Charts/Plots. Since I collected a lot of data, these charts have more detail than the one in your link:https://community.wolfram.com/groups/-/m/t/1705346

I had one chart left on my wish list: a "Gantt" chart (timeline) of attendance which I can use to review who signed-in and signed-out and when. This is the plot I shared.

The code I use is:

AttendanceTimeline[d_Dataset] := Module[{data, l, tlp},
  data = Query[GroupBy[#Name &], All, #Intervals &]@d;
  l = Length@data;
  ticks = Transpose[{Range[l], Normal@Keys@data}];
  tlp = TimelinePlot[
    DateInterval /@ 
     Flatten[Normal@
       Values@Query[GroupBy[#Name &], All, #Intervals &]@d, 1], 
    PlotStyle -> RGBColor[
     0.5058824656863051, 0.41960714747751615`, 0.28627398412570204`], 
    PlotLayout -> "Stacked"];
  Show[tlp, Frame -> {{True, True}, {True, True}}, 
   Options[tlp, FrameTicks] /. {None, None} -> {ticks, None}, 
   AspectRatio -> 1, GridLines -> {Automatic, Range[l]}, 
   GridLinesStyle -> Directive[
RGBColor[0.8784316204832701, 0.8392150364732718, 0.7529403241427501]]]
  ]

It uses a Dataset of participant names, Date (optional, superfluous but handy) and join-leave DateInterval (List). The latter was giving me trouble when creating a TimelinePlot.

Also I found this link on StackExchang which was of great help too: https://mathematica.stackexchange.com/questions/151128/timelineplot-y-axis-misaligned

Anyway, if you are interested in how to analyze conferencing usage logs (e.g. Zoom or Teams), with visualization, I have to write a separate post on this topic.

Cheers,

Dave

POSTED BY: Dave Middleton
Posted 2 years ago

Thanks everyone for the suggestions.

I reviewed my code with fresh eyes, found the issues and solved it (see example for many intervals).

Attachment

Attachments:
POSTED BY: Dave Middleton
Posted 2 years ago

Hi Dave,

Nice! Would you mind sharing your solution so others can benefit from it in the future? I am guessing you did something like

data // Values // Flatten[#, 1] & // TimelinePlot

If you want to compute the number of concurrent viewers over time, take a look at this.

POSTED BY: Rohit Namjoshi

Dave,

probably not the solution, but a problem could be that your time intervals are included in List; try:

assoc = <|  --- your association --- |>
assoc1 = Association@KeyValueMap[#1 -> First[#2] &, assoc];
TimelinePlot[assoc1]

enter image description here

POSTED BY: Henrik Schachner
Posted 2 years ago

Another way to remove the List

First /@ data // TimelinePlot

where data = the association.

POSTED BY: Rohit Namjoshi

Yes, definitely the better way - in Association keys are "transparent"!

POSTED BY: Henrik Schachner
Reply to this discussion
Community posts can be styled and formatted using the Markdown syntax.
Reply Preview
Attachments
Remove
or Discard

Group Abstract Group Abstract