Message Boards Message Boards

0
|
2329 Views
|
2 Replies
|
1 Total Likes
View groups...
Share
Share this post:

How to plot contour in polar form?

Posted 3 years ago

ClearAll["Global`*"];

    \[Epsilon] = 0.5;
    \[Beta] = 45;
    \[Lambda] = 1;
    F = 2000;
    Nu = 829440/(
      103680 - 8640 \[Epsilon]^2 + 3960 \[Epsilon]^4 + 297 \[Epsilon]^6 + 
       40 F^2 \[Epsilon]^6 \[Lambda]^2 + 
       40 F^2 \[Epsilon]^6 \[Lambda]^2 Cos[2 \[Beta]]);
    T1 = Nu (1 /4 (1 - r^2) + \[Epsilon] 1 /
          8 (r^3 - 
            r) Sin[\[Zeta]] + \[Epsilon]^2 (1 /
             24 Cos[2 \[Zeta]] (r^4 - r^2) + (r^2/16 - r^4/32 - 1/32)));
    ContourPlot[T1, {r, -1, 1}, {\[Zeta], 0, 2 Pi}, ContourLabels -> True,
      PlotTheme -> "Scientific", PlotPoints -> 10]`. 

I want to contour plot T in circle geometry not in Cartesian. For example
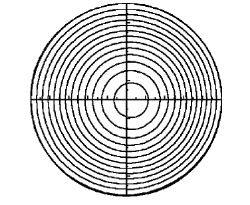
enter image description here.

I am attaching the file too. Please Help!

POSTED BY: KRISHAN SHARMA
2 Replies

This is a way:

ContourPlot[T1 /. {r -> Norm[{x, y}], \[Zeta] -> ArcTan[x, y]},
 {x, -1, 1}, {y, -1, 1}]
POSTED BY: Gianluca Gorni
Posted 3 years ago

Thanks! Can I change the contour lines pattern for r = -1 to 1 dot lines and 0 to 1 with solid lines. In this way I can differentiate the negative and positive regions.

POSTED BY: KRISHAN SHARMA
Reply to this discussion
Community posts can be styled and formatted using the Markdown syntax.
Reply Preview
Attachments
Remove
or Discard

Group Abstract Group Abstract