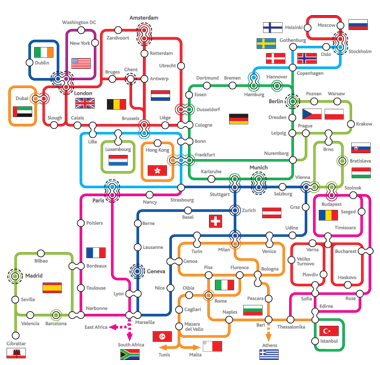
There are some popular use cases fo orthogonal edge layouts that you can recognize from the images below: from subways maps to engineering schematics.

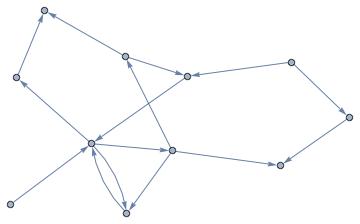
There probably sophisticated algorithms that build such layouts and avoid unreadability issues. But here I would like to suggest a perhaps naive but still quick and clear approach that works with most vertex layouts and allows for customization. Consider a random Graph:
g = RandomGraph[{11, 15}, DirectedEdges -> True]
Let's now define a function that basically draws a BSplineCurve through the start and end vertices passing via one of "other" 2 corners of a rectangle build on a the given edge as diagonal. Which one of 2 corners is chosen randomly.
singlEfolD[x_List, e_] :=
{Arrowheads[{{.05, .4}}],
Arrow@BSplineCurve[{
First[x],
Total[x[[{1, -1}]] RandomSample[{{1, 0}, {0, 1}}]],
Last[x]}, SplineWeights -> {1, 25, 1}]}
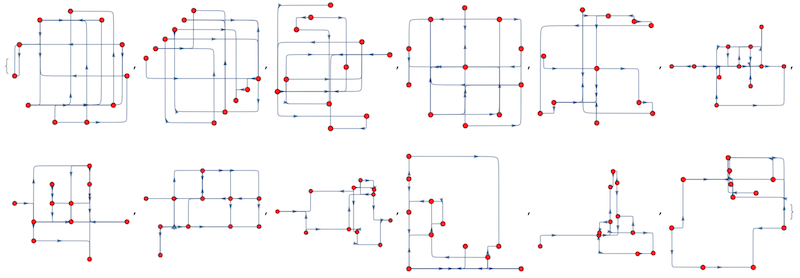
Here is a result applied to several different vertex layouts:
SetProperty[
g, {VertexStyle -> Red, VertexSize -> {"Scaled", .03},
EdgeShapeFunction -> singlEfolD, GraphLayout -> #}] & /@
{"CircularEmbedding", "CircularMultipartiteEmbedding", "SpiralEmbedding", "StarEmbedding",
"BalloonEmbedding", "RadialEmbedding", "LayeredDigraphEmbedding", "LayeredEmbedding",
"HighDimensionalEmbedding", "PlanarEmbedding", "SpectralEmbedding", "TutteEmbedding"}
This is not ideal, this is why we can modify out EdgeShapeFunction to take the following in account:
- Different edge colors plus opacity for better visual edge distinction
- Slight random shifts of controlled magnitude to avoid edge overlaps
- Avoiding placing arrowhead on the folding knee of an edge
- Control folding knee radius
This is the new function:
singlEfolD[r_, n_][x_List, e_] :=
Module[{a = First[x], b = Last[x], c, d, m, ar},
c = a + RandomReal[{-1, 1} n EuclideanDistance[a, b], 2];
d = b + RandomReal[{-1, 1} n EuclideanDistance[a, b], 2];
m = Total[{c, d} RandomSample[{{1, 0}, {0, 1}}]];
ar = EuclideanDistance[d, m]^2/EuclideanDistance[c, d]^2;
{Opacity[.5], Thickness[.01], RandomColor[], Arrowheads[{{.05, ar}}],
Arrow@BSplineCurve[{c, m, d}, SplineWeights -> {1, r, 1}]}
]
Consider a food-web example graph:
g = ExampleData[{"NetworkGraph", "SimpleFoodWeb"}]

And here is an app that allows to explore capabilities of this function:
Manipulate[
SeedRandom[ran];
SetProperty[
g, {EdgeShapeFunction -> singlEfolD[cor, spl], ImageSize -> 500}]
, {{ran, 4, "randomize"}, 1, 1000, 1}
, {{cor, 15, "corner"}, 1, 50}
, {{spl, .05, "split"}, .01, .15}]
If you have older version of Mathematica this can also work with GraphPlot and similar functions:
singlEfolD[x_List] :=
{Arrowheads[{{.02, .4}}],
Arrow@BSplineCurve[{
First[x],
Total[x[[{1, -1}]] RandomSample[{{1, 0}, {0, 1}}]],
Last[x]}, SplineWeights -> {1, 25, 1}]}
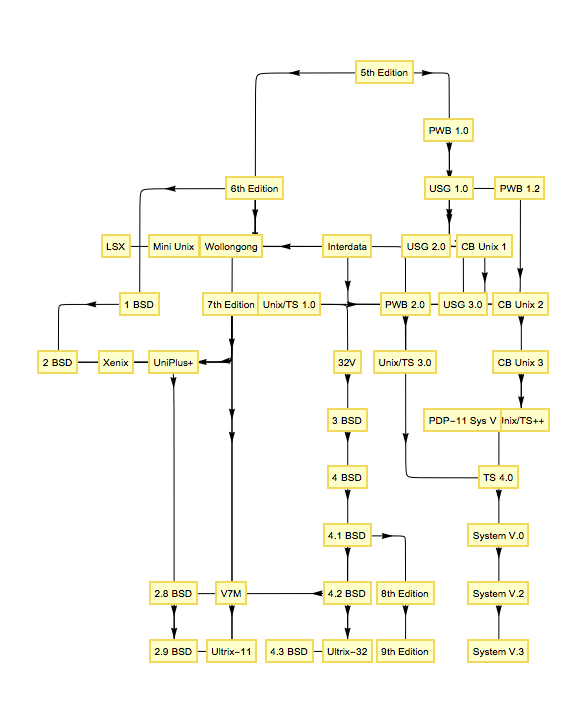
Consider [url=http://wolfram.com/xid/0rkqjm<img src=]hj3jjr2-b7lp76">this example:
g = {"5th Edition" -> "6th Edition", "5th Edition" -> "PWB 1.0",
"6th Edition" -> "1 BSD", "6th Edition" -> "Interdata",
"6th Edition" -> "LSX", "6th Edition" -> "Mini Unix",
"6th Edition" -> "Wollongong", "PWB 1.0" -> "PWB 1.2",
"PWB 1.0" -> "USG 1.0", "1 BSD" -> "2 BSD",
"Interdata" -> "PWB 2.0", "Interdata" -> "Unix/TS 3.0",
"Interdata" -> "7th Edition", "PWB 1.2" -> "PWB 2.0",
"USG 1.0" -> "USG 2.0", "USG 1.0" -> "CB Unix 1",
"7th Edition" -> "2 BSD", "7th Edition" -> "32V",
"7th Edition" -> "Xenix", "7th Edition" -> "Ultrix-11",
"7th Edition" -> "UniPlus+", "7th Edition" -> "V7M",
"PWB 2.0" -> "Unix/TS 3.0", "USG 2.0" -> "USG 3.0",
"CB Unix 1" -> "CB Unix 2", "32V" -> "3 BSD",
"Unix/TS 1.0" -> "Unix/TS 3.0", "USG 3.0" -> "Unix/TS 3.0",
"CB Unix 2" -> "CB Unix 3", "3 BSD" -> "4 BSD",
"V7M" -> "Ultrix-11", "Unix/TS 3.0" -> "TS 4.0",
"CB Unix 3" -> "Unix/TS++", "CB Unix 3" -> "PDP-11 Sys V",
"4 BSD" -> "4.1 BSD", "Unix/TS++" -> "TS 4.0",
"4.1 BSD" -> "8th Edition", "4.1 BSD" -> "4.2 BSD",
"4.1 BSD" -> "2.8 BSD", "2 BSD" -> "2.8 BSD",
"TS 4.0" -> "System V.0", "4.2 BSD" -> "4.3 BSD",
"4.2 BSD" -> "Ultrix-32", "2.8 BSD" -> "2.9 BSD",
"2.8 BSD" -> "Ultrix-11", "System V.0" -> "System V.2",
"8th Edition" -> "9th Edition", "System V.2" -> "System V.3"};
LayeredGraphPlot[g, VertexLabeling -> True, EdgeRenderingFunction -> (singlEfolD[#] &)]
Not ideal - but perhaps someone can find this useful or improve it. This is an update for
THIS post.


