Fully explained how to do with several examples in this blog post "Contingency tables creation examples".
First get the package MathematicaForPredictionUtilities.m from MathematicaForPrediction at GitHub.
Import["https://raw.githubusercontent.com/antononcube/MathematicaForPrediction/master/MathematicaForPredictionUtilities.m"]
Generating data
Data generated in this Stack Overflow answer http://stackoverflow.com/a/8101951 by Mr.Wizard.
Needs["Calendar`"]
key = # -> #2[[1]] &~MapIndexed~{"Region", "Gender", "Style", "Ship Date", "Units", "Price",  "Cost"};
choices = {{"North", "South", "East", "West"}, {"Boy", "Girl"}, {"Tee", "Golf", "Fancy"}, IntegerString[#, 10, 2] <> "/2011" & /@ Range@12,
   Range@15, Range[8.00, 15.00, 0.01], Range[6.00, 14.00, 0.01]};
data = RandomChoice[#, 250] & /@ choices // Transpose;
Additional data assignments:
columnNames = {"Region", "Gender", "Style", "Ship Date", "Units", "Price", "Cost", "TotalCost", "DateObject"};
aColumnNames = AssociationThread[columnNames -> Range[Length[columnNames]]]

(* <|"Region" -> 1, "Gender" -> 2, "Style" -> 3, "Ship Date" -> 4, "Units" -> 5, "Price" -> 6, "Cost" -> 7, "TotalCost" -> 8, "DateObject" -> 9|> *)

data = Map[Append[#, #[[aColumnNames["Units"]]]*#[[aColumnNames[["Cost"]]]]] &, data];
data = Map[Append[#, DateObject@#[[aColumnNames["Ship Date"]]]] &, data];
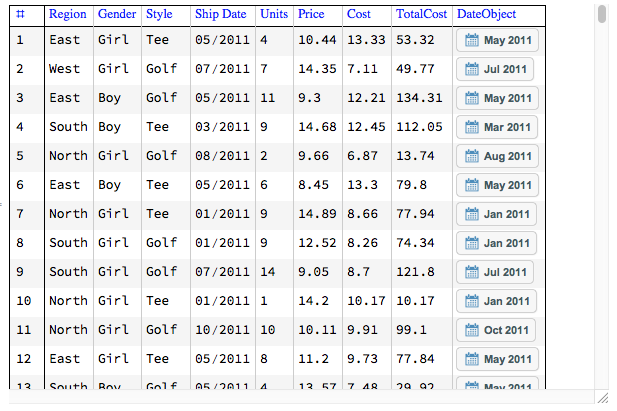
This how the data looks like:
Pane[GridTableForm[data, TableHeadings -> columnNames], ImageSize -> {600, 400}, Scrollbars -> True]

Using CrossTabulate
xtab = CrossTabulate[
   data[[All, aColumnNames /@ {"Gender", "Style", "TotalCost"}]]];
MatrixForm[#1, TableHeadings -> {#2, #3}] & @@ xtab

Using xtabsViaRLink
Install R first:
Needs["RLink`"]
RLinkResourcesInstall[]
InstallR[]
The function xtabsViaRLink calls R's xtabs :
rxtab = FromRXTabsForm@
   xtabsViaRLink[
    data[[All,
      aColumnNames /@ {"Gender", "Style", "TotalCost"}]], {"Gender",
     "Style", "TotalCost"}, "TotalCost ~ Gender + Style"];
MatrixForm[#1, TableHeadings -> {#2, #3}] & @@ rxtab
