MODERATOR NOTE: a submission to computations art contest, see more: https://wolfr.am/CompArt-22
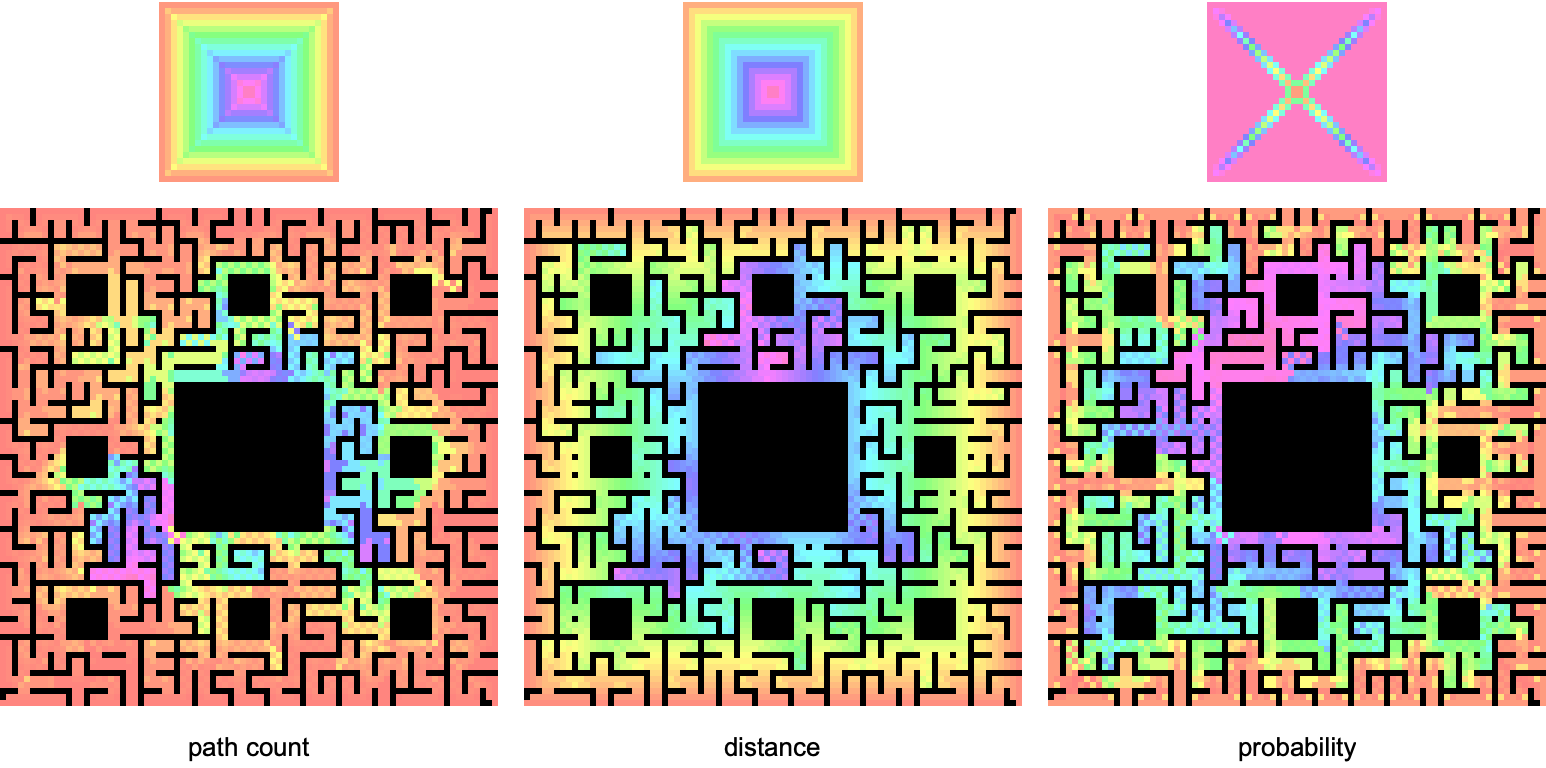
Actually there is no obvious definition for the center of a maze, so we might as well try a few more calculations using DirectedAcyclicEvaluate. The graphs above are made with three different choices of vertex function:
nnbgDAG = ToDirectedAcyclicGraph[nnbg, Cases[VertexList[nnbg],
    {1, _} | {_, 1} | {83, _} | {_, 83}]];

pathCount = Function[{values, edgeWeights, edges},Total[values] ];

distance = Function[{values, edgeWeights, edges},  values[[1]] + 1 ];

probability = Function[{values, edgeWeights, edges},
   Total[Times[values,1/VertexOutDegree[nnbgDAG,
      #] & /@ edges[[All, 1]]  ] ] ];
It would be a little more sophisticated to calculate probabilities using edge weights, but presently the source code is missing an important optimization using Association (see end note below). It's interesting to compare these functions, and such analysis can possibly help us find our way past the center of the maze and to escape, whatever that actually means.
Assuming a maze explorer can start anywhere on the boundary and moves with constant velocity, minimum distance from the wall to any interior point is proportional to minimal time. Thus distance acts as a time axis, which increases toward magenta. The probability function is correlated to the distance / time function because, as time goes on, maze explorers run out of space to explore. More definitely said, the probability function equally splits values when through-putting along directed edges, so a partial probability amplitude is conserved from time
$t$ to
$t+1$ only if its location in the maze graph has at least one out component as a next move. As this is not the case for the entire graph, we observe the probability amplitude falling off exponentially with distance / time:
leveledVertices = SortBy[GatherBy[
     DirectedAcyclicEvaluate[nnbgDAG,
       {{_, _} -> 1}, distance]["VertexWeights"],
     #[[2]] &], #[[1, 2]] &][[All, All, 1]];

probs = Total /@ (leveledVertices /. DirectedAcyclicEvaluate[ nnbgDAG,
      {{_, _} -> 1}, prob]["VertexWeights"]);

ListPlot[probs/276, PlotRange -> All,
 AxesLabel -> {"distance/time", "probability"}]
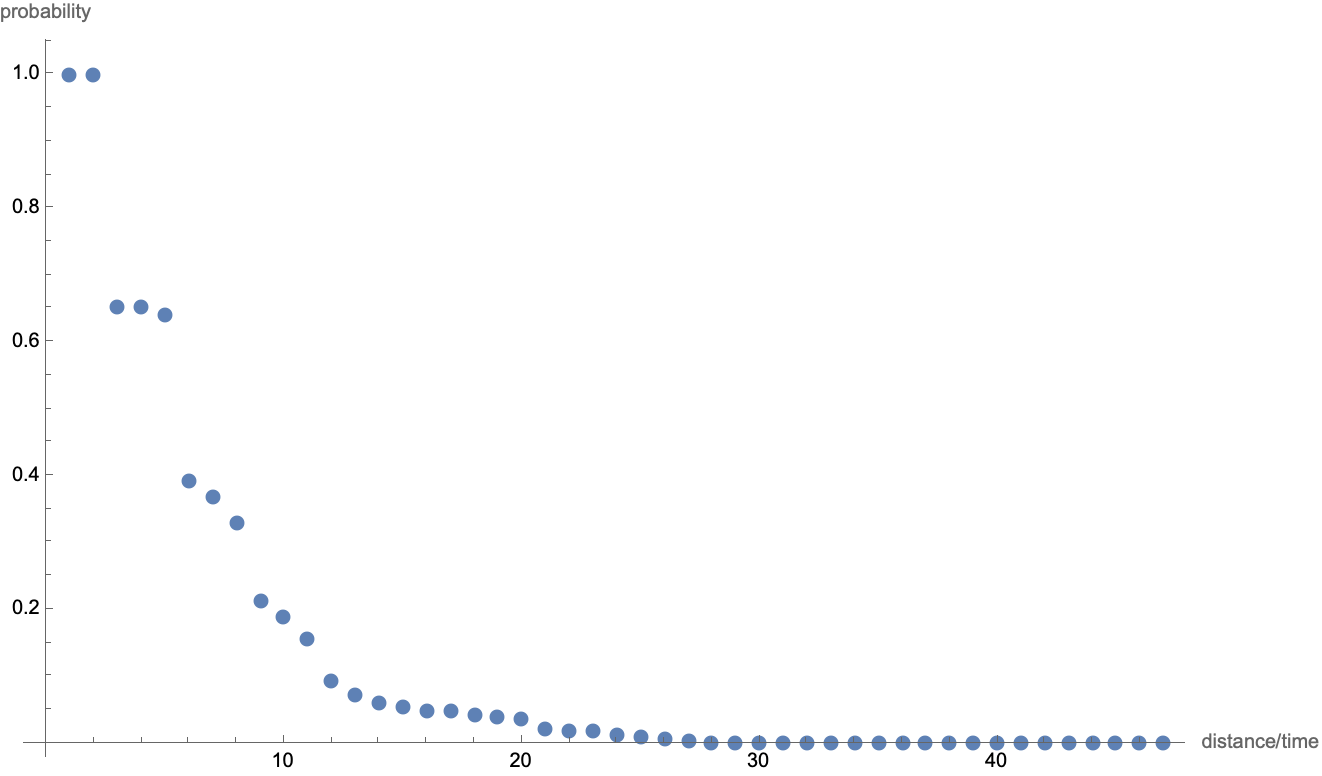
This plot somewhat reminds us of quantum mechanical tunneling, but I'll refrain from speculating about possible future physics directions. The graph functions don't account for Schroedinger phases (yet), so there's really no need to mention Quantum.
We previously mentioned a limitation to the metrics above is that, for any chosen starting point, the underlying directed acyclic graph does not reach out to every other location of the maze. In practice, this limits the drama from what it could possibly be when allowing characters to take paths across the entire maze.
One way to correct this deficit is to use only one starting location when calculating the shortest path map of the maze. If we then make shortest path graphs for every possible initial condition, we can sum over all initial conditions to obtain a new set of more detailed measurements of the maze. Now for a little more code:
compGraphs = WeaklyConnectedGraphComponents[nnbg];
initConditions = Cases[VertexList[#],
     {1, _} | {_, 1} | {83, _} | {_, 83}] & /@ compGraphs;

dags1 = ToDirectedAcyclicGraph[compGraphs[[1]], {# },
     VertexCoordinates -> Automatic
     ] & /@ initConditions[[1]];

dags2 = ToDirectedAcyclicGraph[compGraphs[[2]], {# },
     VertexCoordinates -> Automatic
     ] & /@ initConditions[[2]];

matrixPathData = Function[{graph},
    ReplacePart[Array[0 &, {83, 83}],
     DirectedAcyclicEvaluate[graph,
       {{_, _} -> 1}]["VertexWeights"]]] /@ dags;

matrixProbData = Function[{graph},
    ReplacePart[Array[0 &, {83, 83}],
     DirectedAcyclicEvaluate[graph,
       {{_, _} -> 1},
       Function[{values, edgeWeights, edges},
        Total[Times[values,
          1/VertexOutDegree[graph, #] & /@ edges[[All, 1]] ] ] ]
       ]["VertexWeights"]]] /@ dags;

matrixDistData = Function[{graph},
    ReplacePart[Array[0 &, {83, 83}],
     DirectedAcyclicEvaluate[graph,
       {{_, _} -> 1},
       Function[{values, edgeWeights, edges},
        values[[1]] + 1 ]
       ]["VertexWeights"]]] /@ dags;
All told it takes about 5-10 minutes to do a similar calculation over 250+ initial conditions, and then we can plot the revised metrics:
HueScaleArrayPlot[summedData_] := With[
  {countsRep = MapIndexed[#1 -> #2[[1]] &,
     DeleteCases[Union[Flatten[summedData]], 0 | -1]]},
  ArrayPlot[Transpose@summedData,
   ColorRules -> Join[# -> Lighter[Hue[
          (# /. countsRep)/Length[countsRep[[All, 1]]]/1.1
          ], .5] & /@ countsRep[[All, 1]], {0 -> Black, -1 -> Red}],
   Frame -> None, PixelConstrained -> 3]]

HueScaleArrayPlot[Total[#]] & /@ {matrixPathData, matrixDistData,
  matrixProbData}

Higher precision path count and distance measurements are more sensitive to the difficult of accessing certain exterior sections of the maze. The probability metric changes less significantly, continuing to highlight north center as the most difficult region to reach.
Let's assume for the next play, the bishop and the actress are going to enter the maze from different directions, and attempt to synchronize their movements so as to end up leaving the maze together on a distinct third direction. For one path, It is possible to enter South East and exit North center, choosing both endpoints in bottlenecked subspaces. We can plot the multiway subgraph as follows:
VertexKeep[graph_, vertices_, OptionsPattern[Graph]
  ] := VertexDelete[graph,
  Complement[VertexList[graph], vertices],
  Sequence @@ (#[[1]] -> OptionValue[#[[1]]] & /@ Options[Graph])]

Graph[HighlightGraph[compGraphs[[1]],
  Style[VertexKeep[compGraphs[[1]],
    VertexInComponent[dags1[[139]], {28, 1}, Infinity]],
   Orange, Thick]], VertexCoordinates -> (
   # -> Times[#, {1, -1}
       ] & /@ VertexList[dags1[[139]]]), ImageSize -> 500]
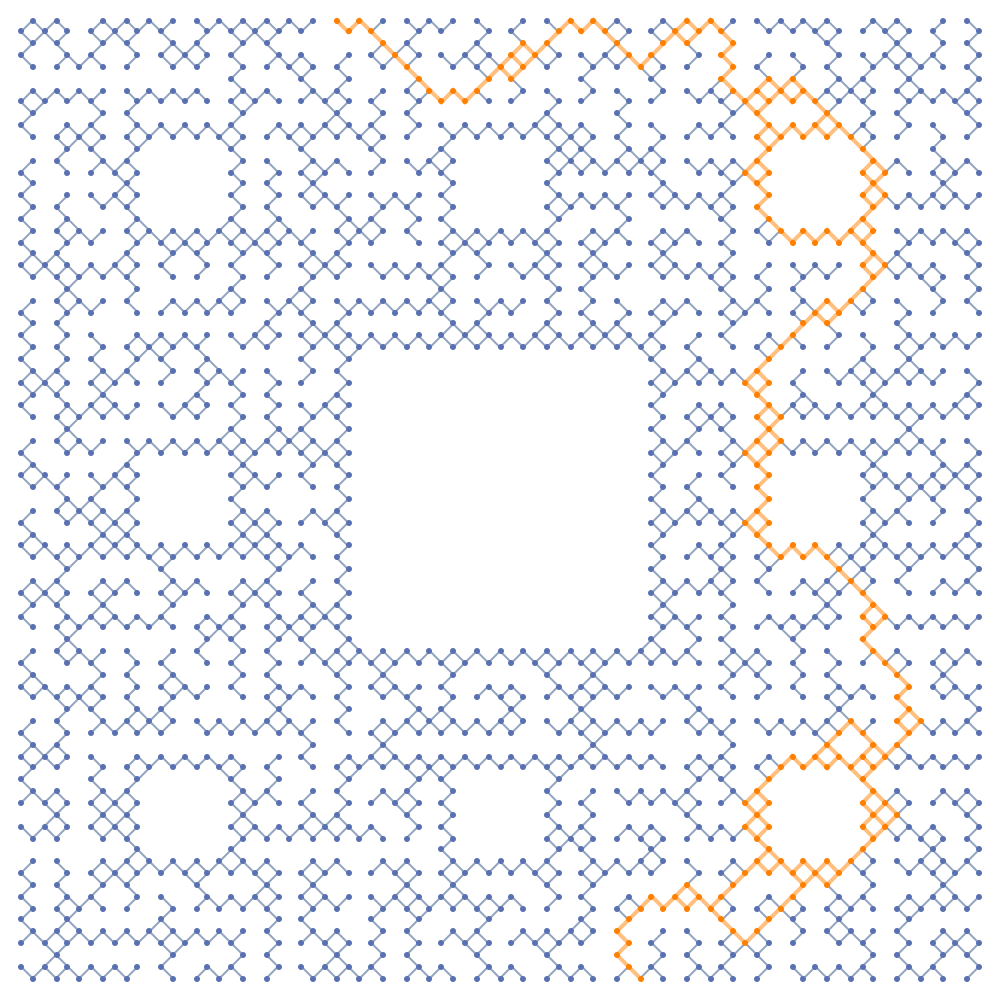
Now by fixing one component of matrix distance data and scanning over components on the second sublattice, we can look through pair correlations to try and find a synchronous partner function:
unsorted = # - Mean[initConditions[[2]]] & /@ initConditions[[2]];
sorted = SortBy[unsorted, N[(ArcTan @@ # + Pi)] &];
inds = Flatten[Position[unsorted, #] & /@ sorted];

correlationData =
  HueScaleArrayPlot[matrixDistData[[139]] + matrixDistData[[140 + #]]
     ] & /@ Join[Range[139][[inds]], Table[272 - 140, {50}]];
ListAnimate[%]
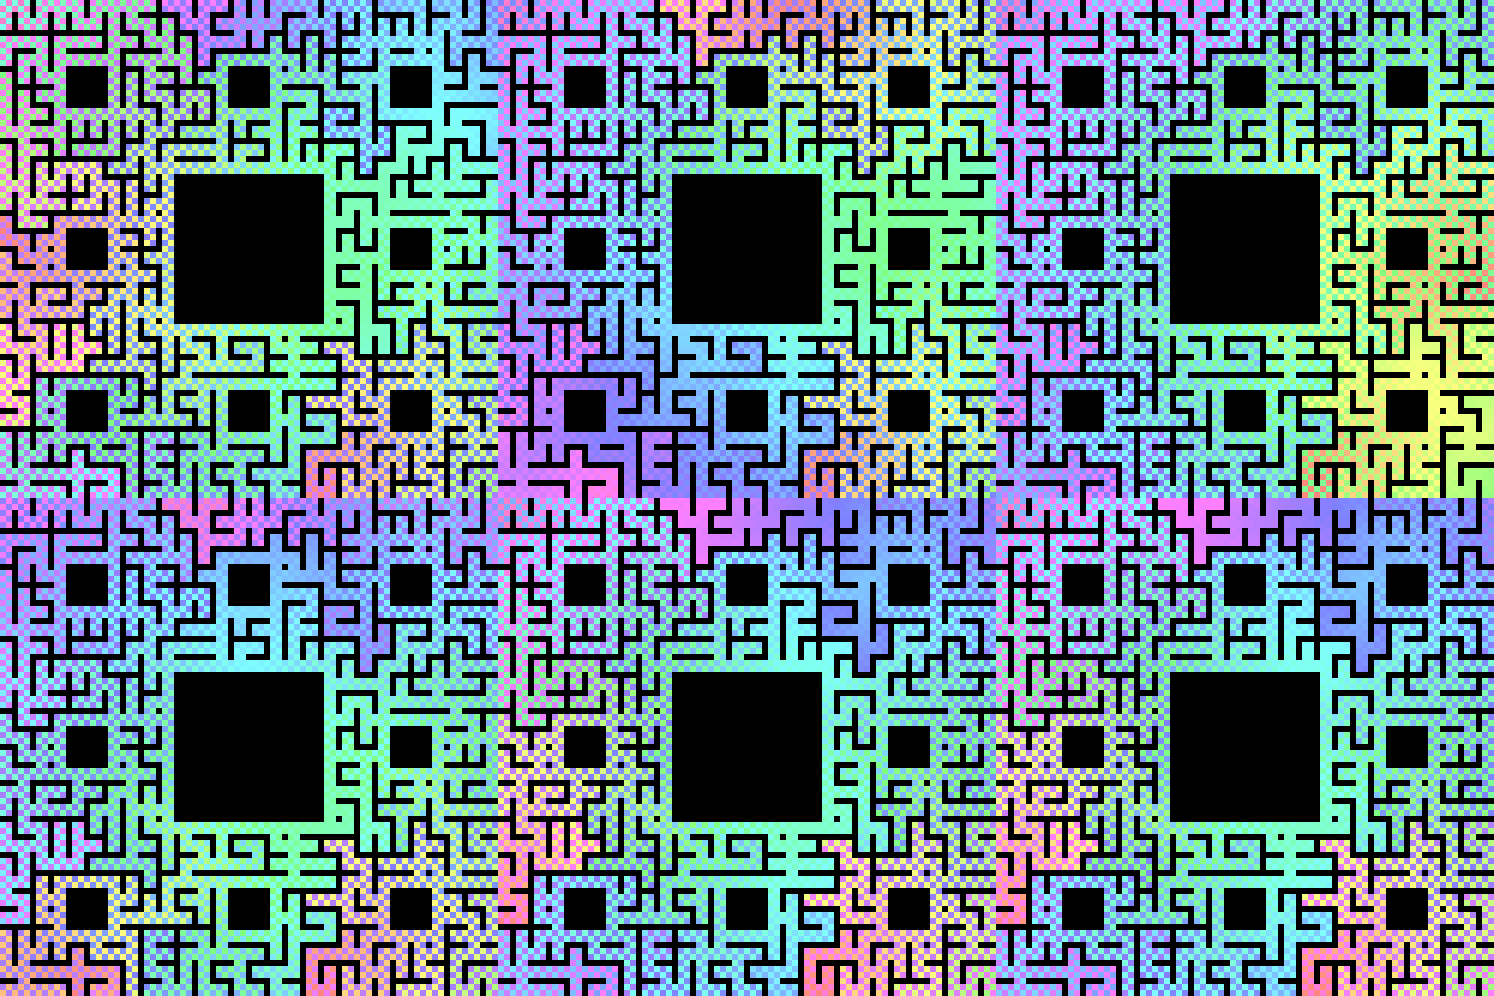
In this image player 1's starting point is fixed while player 2's starting point rotates clockwise around the boundary. In the end, we find one particularly nice and synchronous convergence of separate paths:
Image[HueScaleArrayPlot[
  matrixDistData[[139]] + matrixDistData[[272]]
], ImageSize -> 6*83]
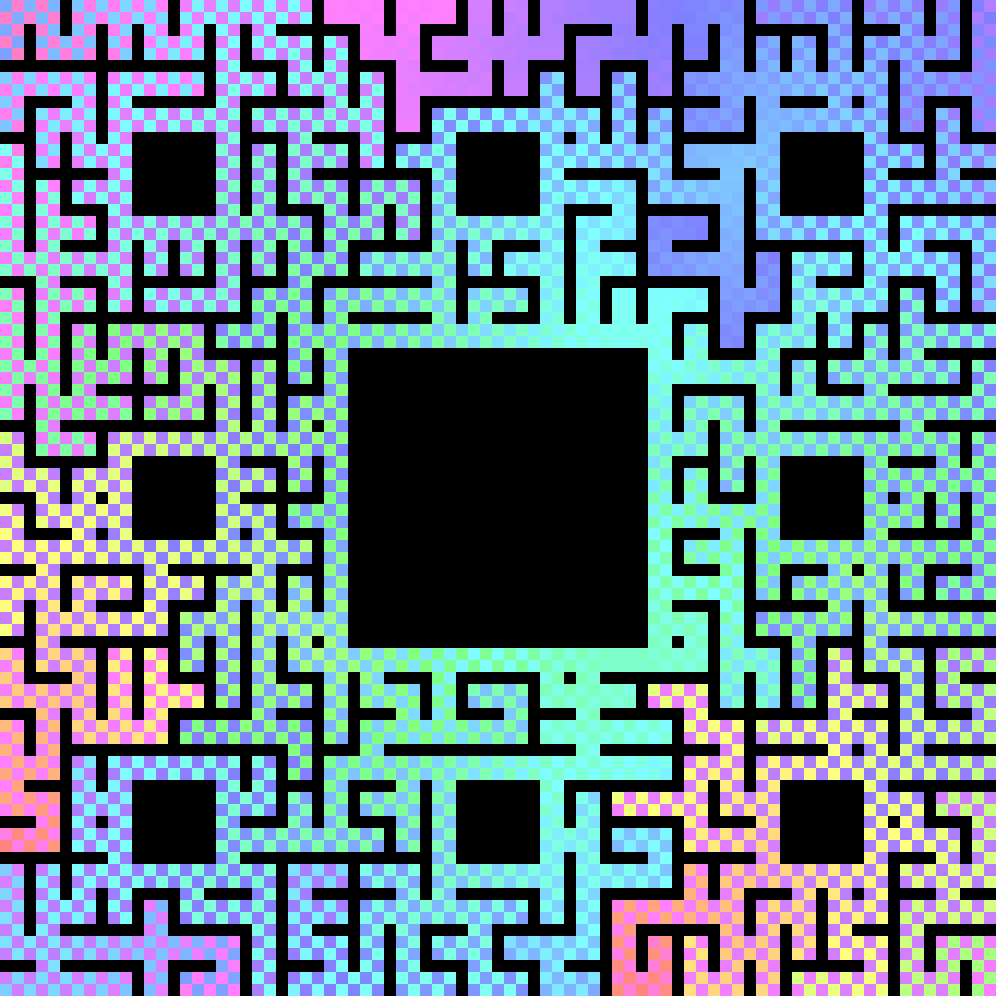
And the
$(A_1,A_2) \rightarrow B$ multiway subgraph function looks as follows:
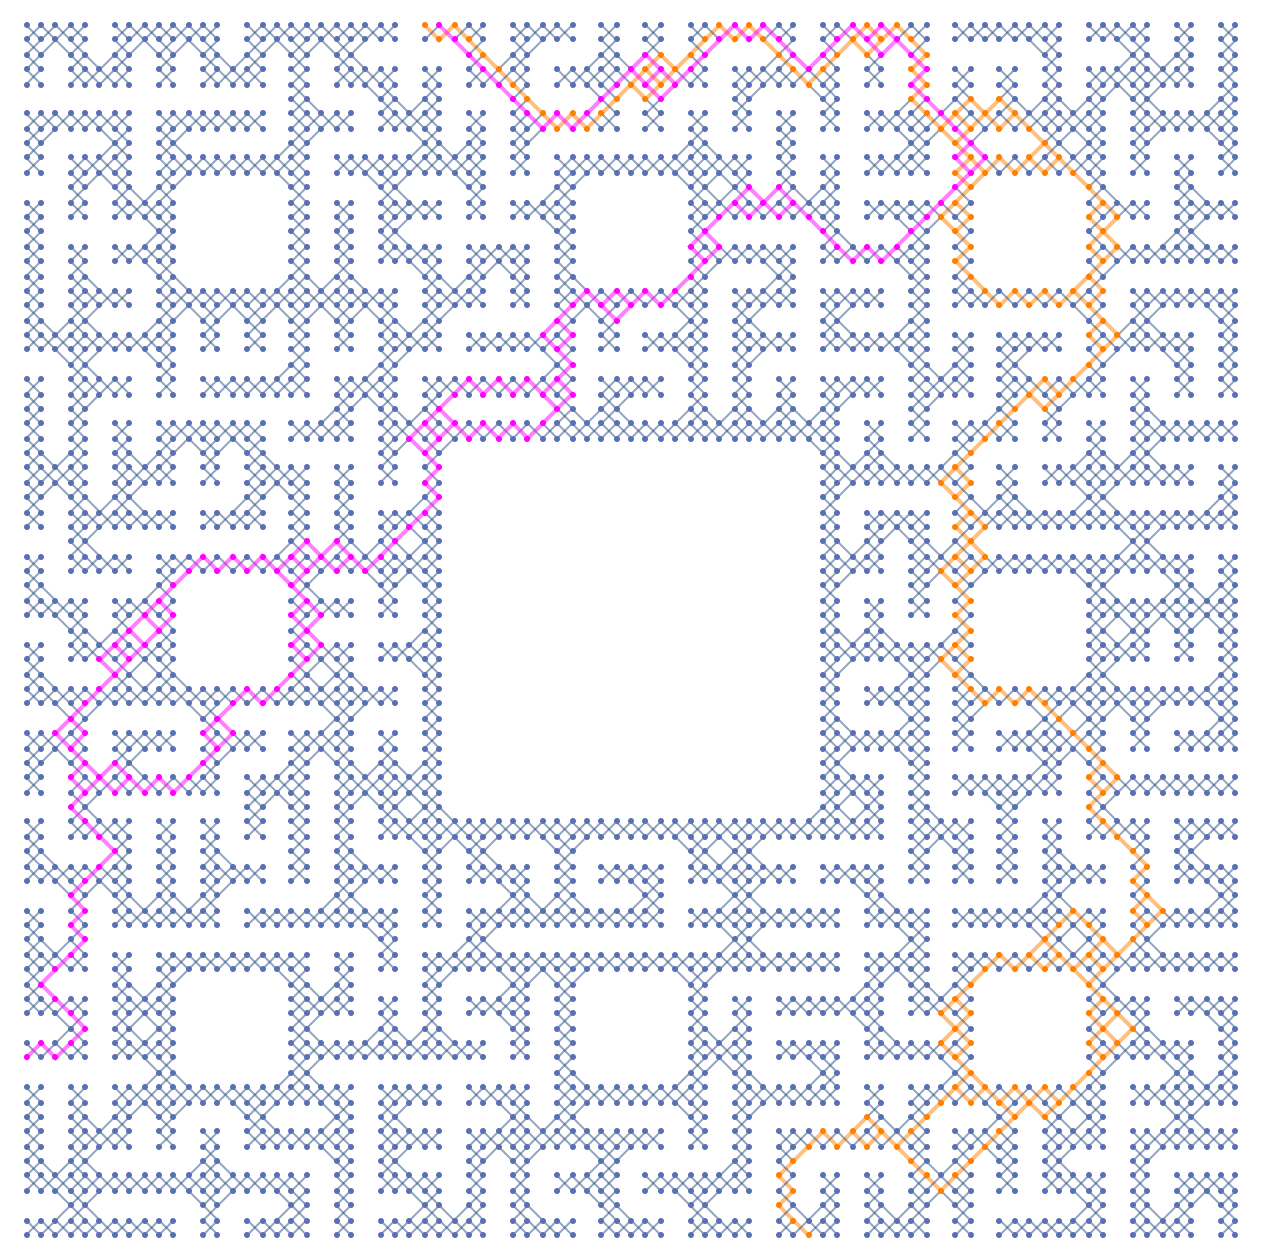
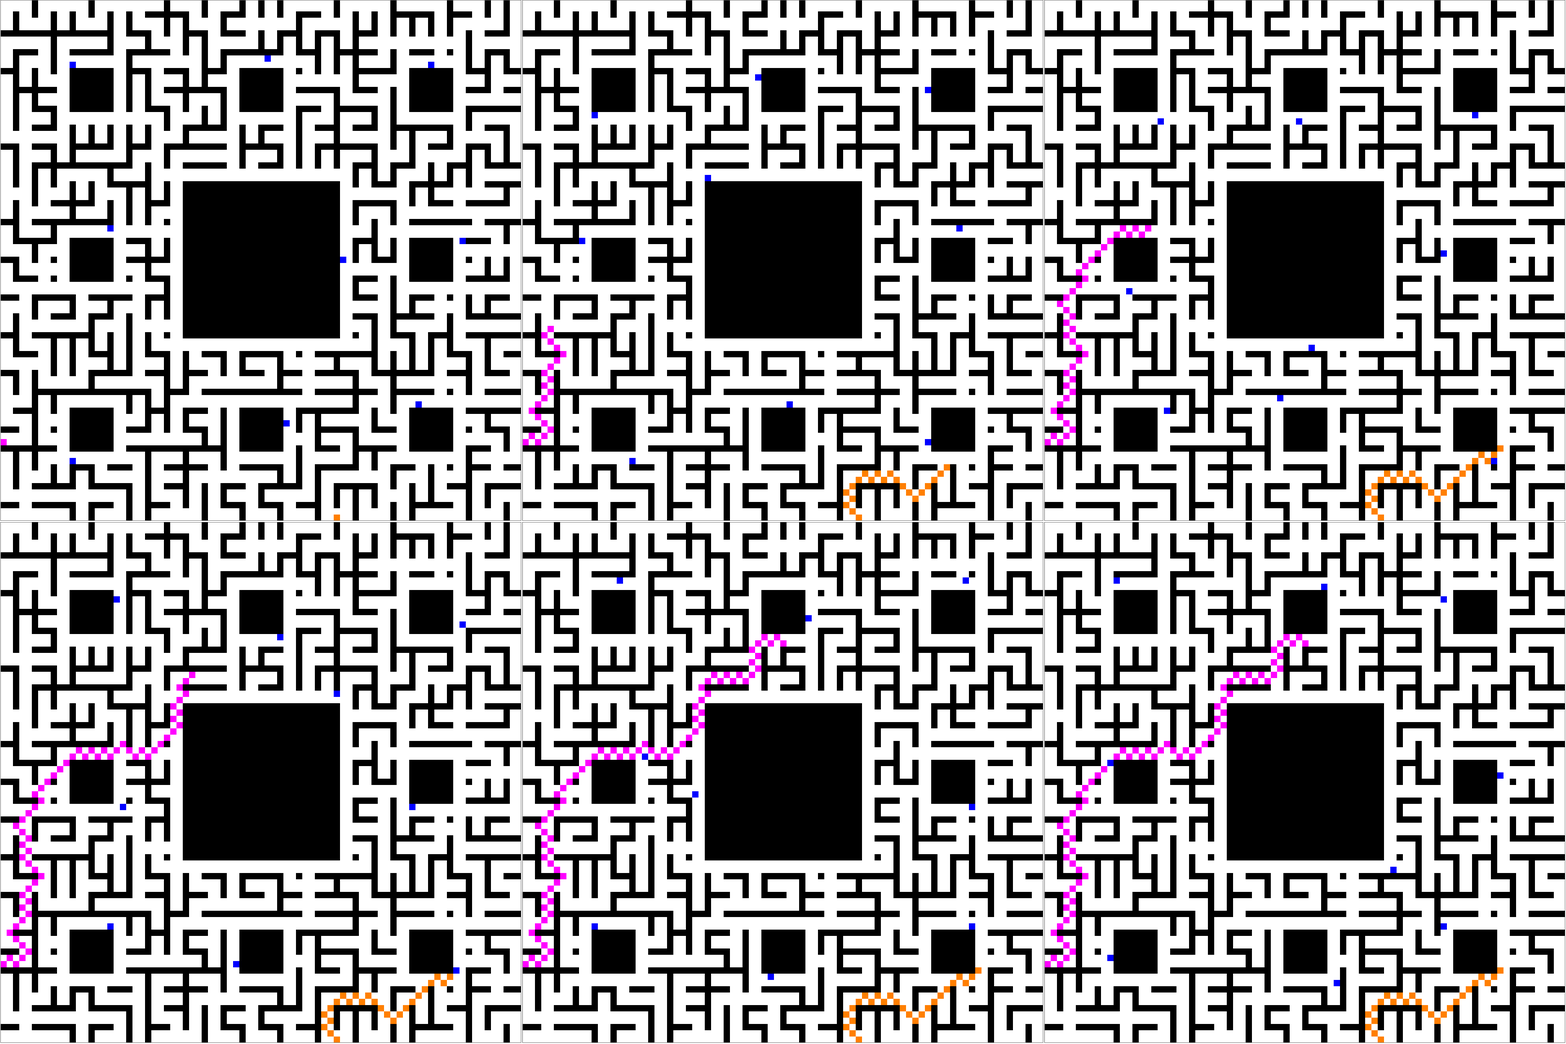
It looks like a pretty good plan, but not if king so-and-so (or perhaps one of the saintly seven) happens to hear about it. Whatever pre-existing powers may not see it in their interest that the Bishop and the Actress should meet in the maze and end up leaving together. The scene is much more dramatic if the players have a chance of being intercepted by knights patrolling around maze cycles:
Of course, it's always possible to choose another random seed, and then the meet-and-escape can happen despite the menacing presence of the blue knights:
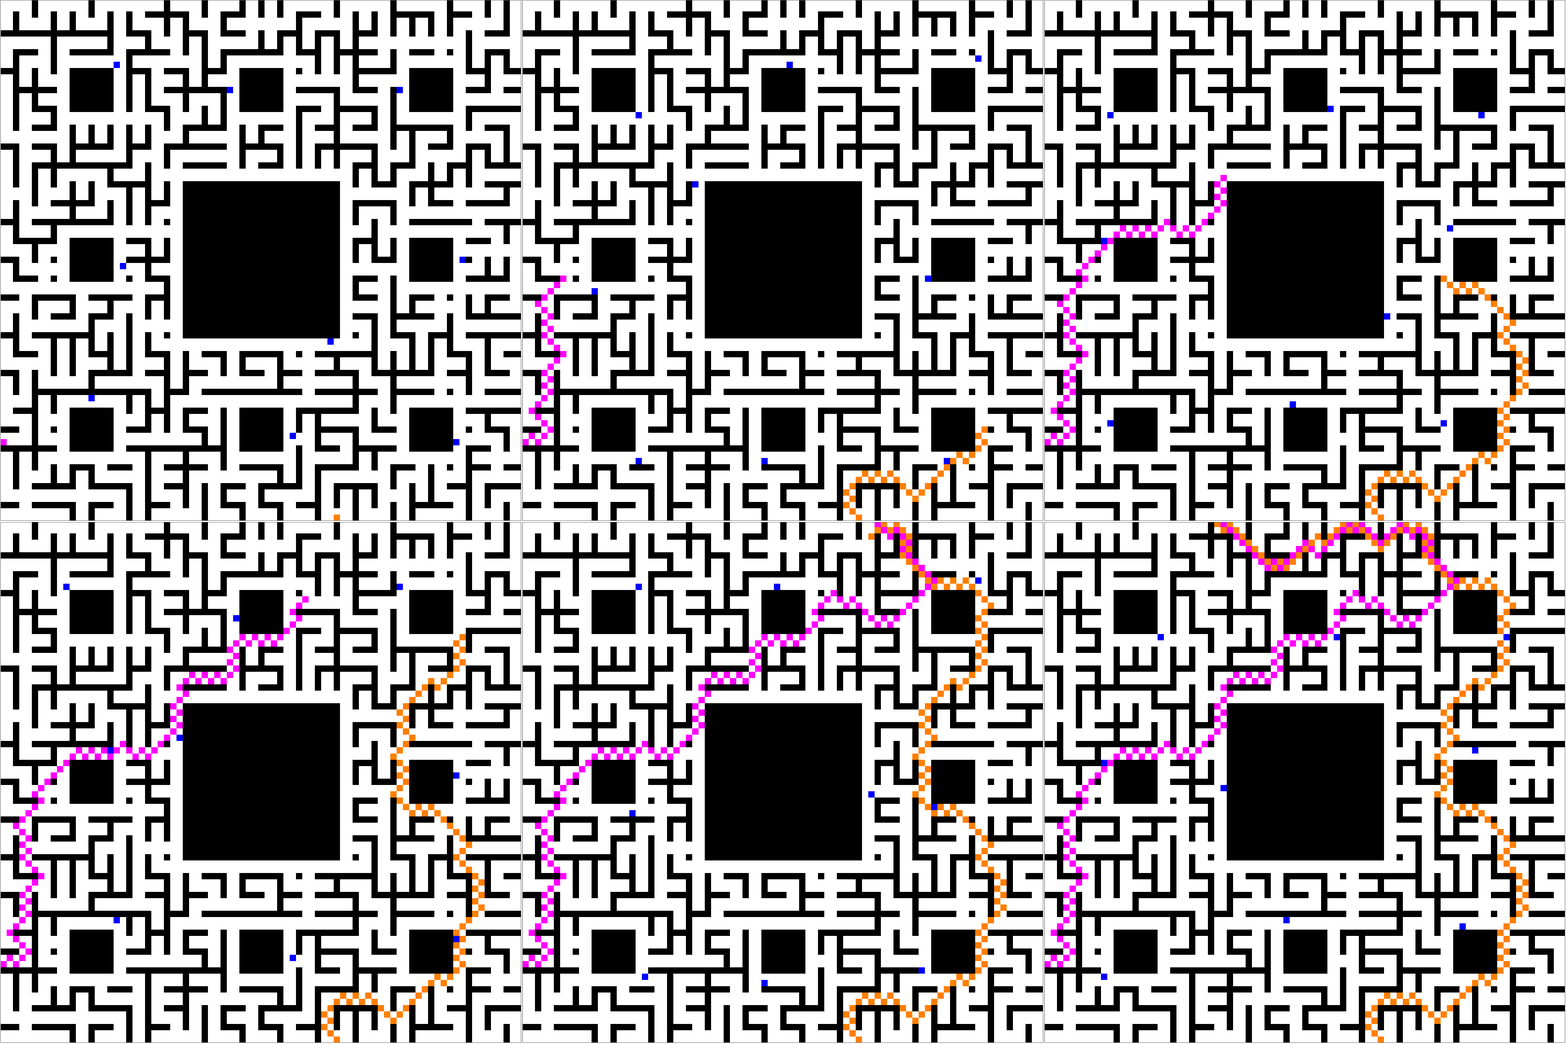
These plots prove a concept, but leave more to desire. Shouldn't the players have more of an ability to avoid knights? And shouldn't the knights make more of an effort to give chase? Yes, of course, but please don't discredit incremental progress on account of a future that doesn't yet exist.
End Note
Pay attention to this timing test, now not to use replace rules:
rules = # -> # & /@ Range[1000];
rulesf = Association[rules];
t1 = RepeatedTiming[rulesf[RandomInteger[1000]]];
t2 = RepeatedTiming[RandomInteger[1000] /. rules];
t2[[1]]/t1[[1]]

Out[] > 75