Group Abstract Group Abstract

Message Boards Message Boards

0
|
5.8K Views
|
5 Replies
|
3 Total Likes
View groups...
Share
Share this post:

Non-linear data fitting: Overflow occurred in computation?

Posted 3 years ago

I have an imported data set

data1 = {{1.`*^-16, 0.`}, {7.746`, 0.1129`}, {13.4164`, 
    0.1554`}, {17.3205`, 0.1891`}, {20.4939`, 0.2139`}, {24.4949`, 
    0.2587`}, {30.`, 0.3351`}, {34.641`, 0.4076`}, {38.7298`, 
    0.4437`}, {42.4264`, 0.4992`}, {51.9615`, 0.646`}, {60.`, 
    0.7401`}, {67.082`, 0.8343`}, {73.4847`, 0.9055`}, {79.3725`, 
    0.9594`}, {84.8528`, 0.9615`}, {90.`, 0.9541`}, {94.8683`, 
    0.9723`}, {99.4987`, 0.9951`}, {103.923`, 0.9901`}, {108.1665`, 
    0.989`}, {112.2497`, 1.`}, {116.1895`, 0.9898`}, {120.`, 
    0.9876`}};

Which I'd like to fit to an equation. (in the screenshot)enter image description here

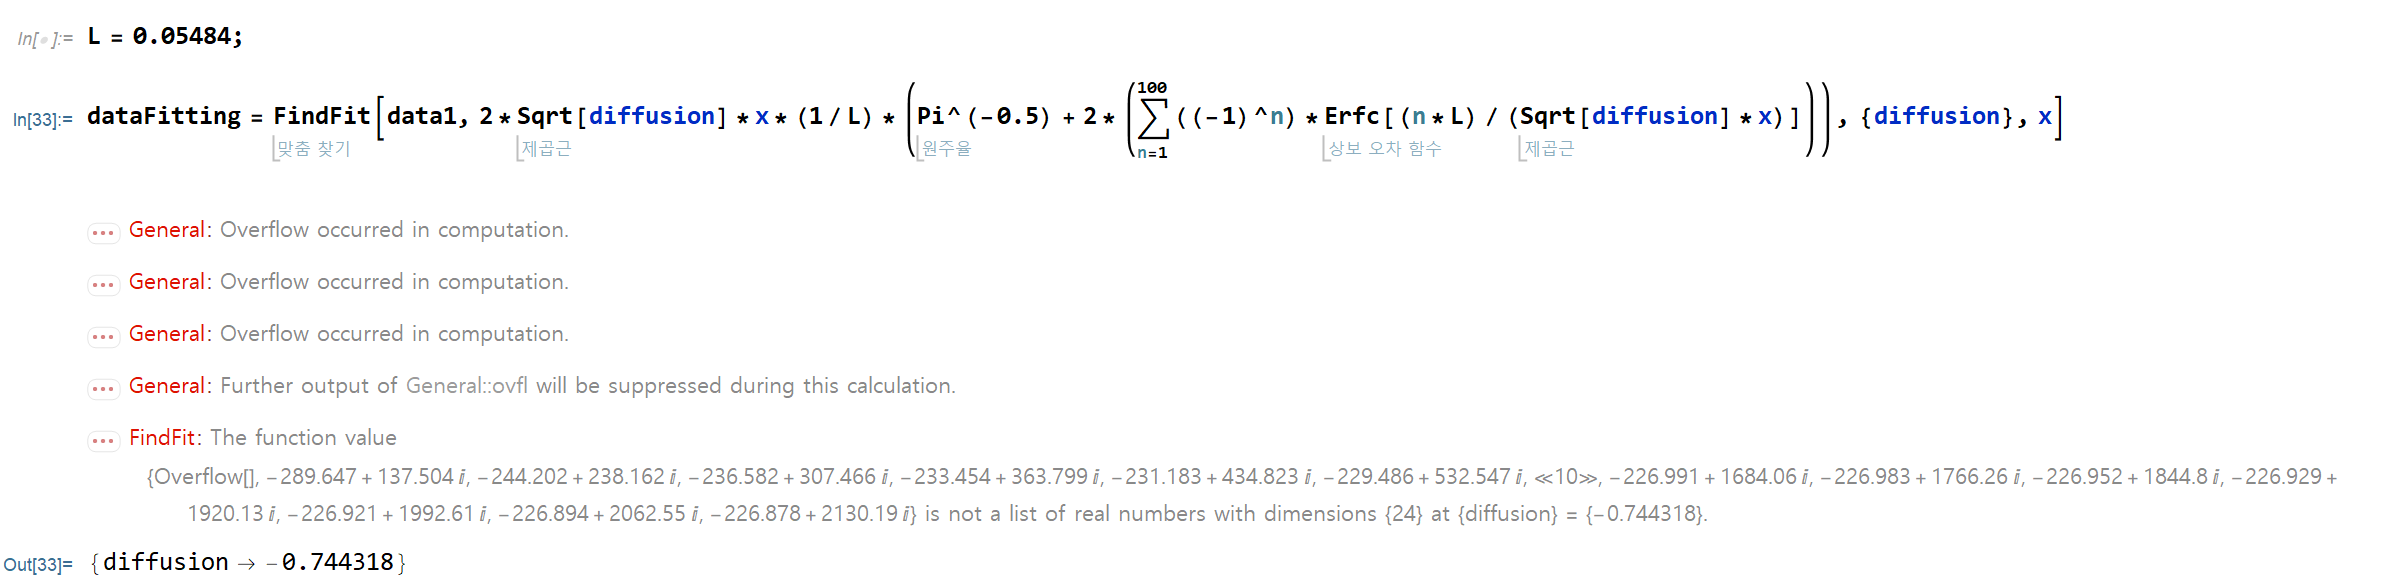
It seems that I've done something wrong along the way, but I can't seem to find it. The fitting parameter that Mathematica has given me is negative, which is obviously ridiculous.

Attachments:
POSTED BY: Jung Hwan Kim
5 Replies
Posted 3 years ago
POSTED BY: Jim Baldwin

Thank you for this enlightenment. I'll try to work things out with my function. Although I haven't been able to solve this, I've got some valuable tips from your coding.

Thank you again, and have a lovely day!

POSTED BY: Jung Hwan Kim

Your fitting function is a horrible fit to your data. You must have something wrong. To visualize this do the following:

Manipulate[
 Show[ListLinePlot[data1, PlotStyle -> Orange], 
  Plot[2*Sqrt[diffusion]*x*(1/L)*(Pi^(-0.5) + 2*(\!\(
\*UnderoverscriptBox[\(\[Sum]\), \(n = 
           1\), \(100\)]\(\((\((\(-1\))\)^n)\)*
          Erfc[\((n*L)\)/\((Sqrt[diffusion]*x)\)]\)\))), {x, 0, 120}],
   PlotRange -> All], {diffusion, 0.0001, 1}]

You can sweep through values of diffusion and see it is a horrible fit. To get a "Best Fit" (which is equally horrible!) you need to constrain the value of diffusion to positive values to avoid imaginary numbers:

In[4]:= dataFitting = 
 FindFit[data1, {2*Sqrt[diffusion]*x*(1/L)*(Pi^(-0.5) + 2*(\!\(
\*UnderoverscriptBox[\(\[Sum]\), \(n = 
           1\), \(100\)]\(\((\((\(-1\))\)^n)\)*
          Erfc[\((n*L)\)/\((Sqrt[diffusion]*x)\)]\)\))), 
   diffusion > 0.0}, {diffusion}, x]

Out[4]= {diffusion -> 0.00911926}

Which gives you the "Best Fit" of:

function = 2*Sqrt[diffusion]*x*(1/L)*(Pi^(-0.5) + 2*(\!\(
\*UnderoverscriptBox[\(\[Sum]\), \(n = 
          1\), \(100\)]\(\((\((\(-1\))\)^n)\)*
         Erfc[\((n*L)\)/\((Sqrt[diffusion]*x)\)]\)\))) /. 
  dataFitting; 
Show[ListLinePlot[data1, PlotStyle -> Orange], Plot[function, {x, 0, 120}], 
     PlotRange -> All]

enter image description here

Which is not very good but "As good as you can get" with that function as your fitting function.

Regards,

Neil

POSTED BY: Neil Singer

Well, I've tried that, but I now have a new set of errors. enter image description here

POSTED BY: Jung Hwan Kim
Posted 3 years ago

Your first number is {1.*^-16, 0.} which is essentially two zeros. Maybe try to change it {0, 0}?

POSTED BY: Ehud Behar
Reply to this discussion
Community posts can be styled and formatted using the Markdown syntax.
Reply Preview
Attachments
Remove
or Discard